Statistical Significance Testing: A Practical Guide
- statistical significance testing
- data analysis
- a/b testing
- cro
- statistics guide
Launched
June, 2026
You've probably had this moment already. A new landing page goes live, the dashboard starts moving, and someone on the team asks, “So, did it work?”
At first, the answer seems simple. Sales are a bit up. Add-to-cart clicks look stronger. The new version feels cleaner. But “feels better” and “is actually better” are not the same thing. Some changes win because they genuinely improve behaviour. Others only look good because of random variation.
That's where statistical significance testing becomes useful. It gives you a disciplined way to separate signal from noise. Especially for marketers and CRO teams, it helps you avoid shipping changes based on wishful thinking.
The tricky part is that many explanations stop too early. They define p-values, mention the usual threshold, and leave you with the impression that a “significant” result is automatically worth acting on. In practice, that's where the critical business question begins. A result can be statistically significant and still not be worth the development time, design effort, or rollout risk.
Is Your New Website Design Actually Working?
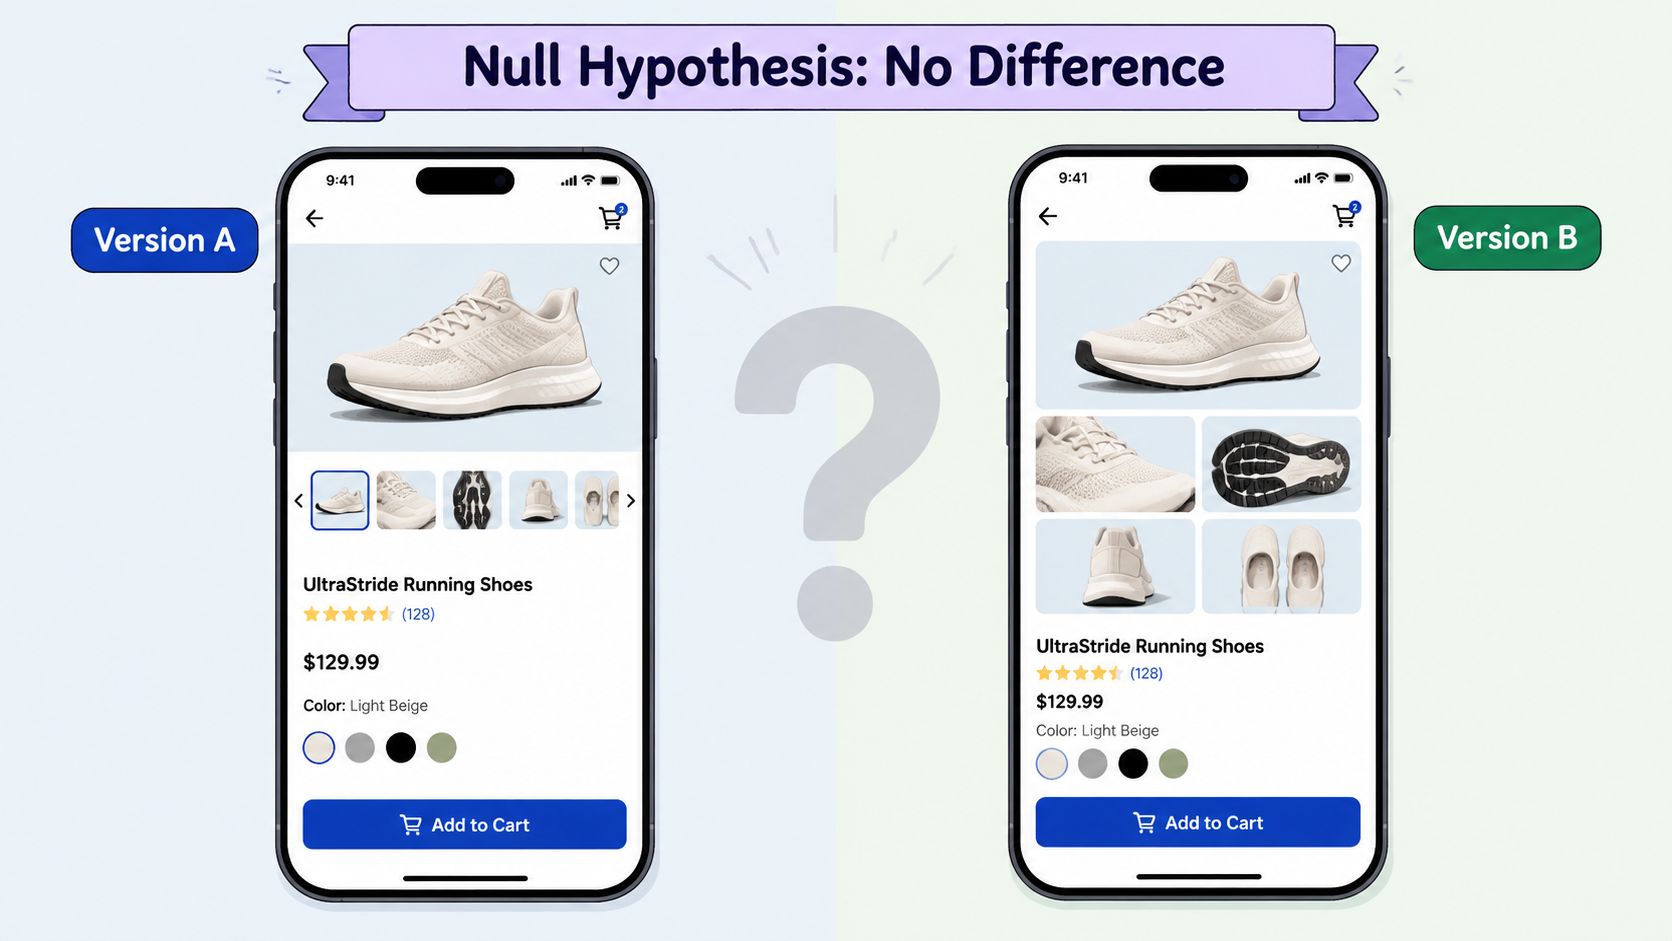
You swap a blue button for an orange one on a product page. By the end of the week, the variant appears to be ahead. The designer is pleased. The paid team wants to send more traffic. Your founder asks whether this should go live across the whole shop.
You can't answer that responsibly by eyeballing the dashboard.
What you need to know is whether the observed lift is likely to reflect a real change in customer behaviour or whether it could easily have happened by chance. That's the everyday job of statistical significance testing in ecommerce. It sits behind A/B tests, email experiments, ad creative comparisons, and checkout tweaks.
For a marketing manager, the value is practical. It reduces the odds of celebrating a false win. It also helps you avoid killing a promising test too early just because the first few days look messy.
A good process starts before the stats. You still need a sensible test idea, clean tracking, and a page worth improving. If you're looking for broader optimisation ideas before testing individual elements, these actionable tips for better conversions are a useful starting point. And if your Shopify store has deeper friction points, a structured Shopify CRO audit helps identify what should be tested first.
The biggest mistake isn't using statistics. It's using them on top of a weak experiment.
What teams usually get wrong
Most confusion starts with one of these assumptions:
- A small lift must be real: Early movement often looks more convincing than it is.
- A significant result means ship it: Significance answers one question. It doesn't answer whether the change matters commercially.
- More dashboards mean more certainty: Extra charts don't fix a weak test design.
That last point matters. Statistical significance testing is not a badge you attach to any result. It's a method for judging evidence under uncertainty. Used well, it sharpens decisions. Used casually, it gives weak decisions a scientific gloss.
The Core Idea of Hypothesis Testing and P-Values
At the centre of statistical significance testing is a simple structure. You begin with a default assumption and then ask whether your data provide enough evidence to challenge it.
In most business tests, that default assumption is the null hypothesis. For your product page test, the null hypothesis says the new version has no real effect on conversion behaviour. The alternative hypothesis says there is a real difference.
A courtroom analogy helps. In a trial, the starting point is “innocent until proven guilty”. In testing, the starting point is “no effect until the data give us enough reason to doubt that”. You don't begin by assuming your redesign worked. You begin sceptically.
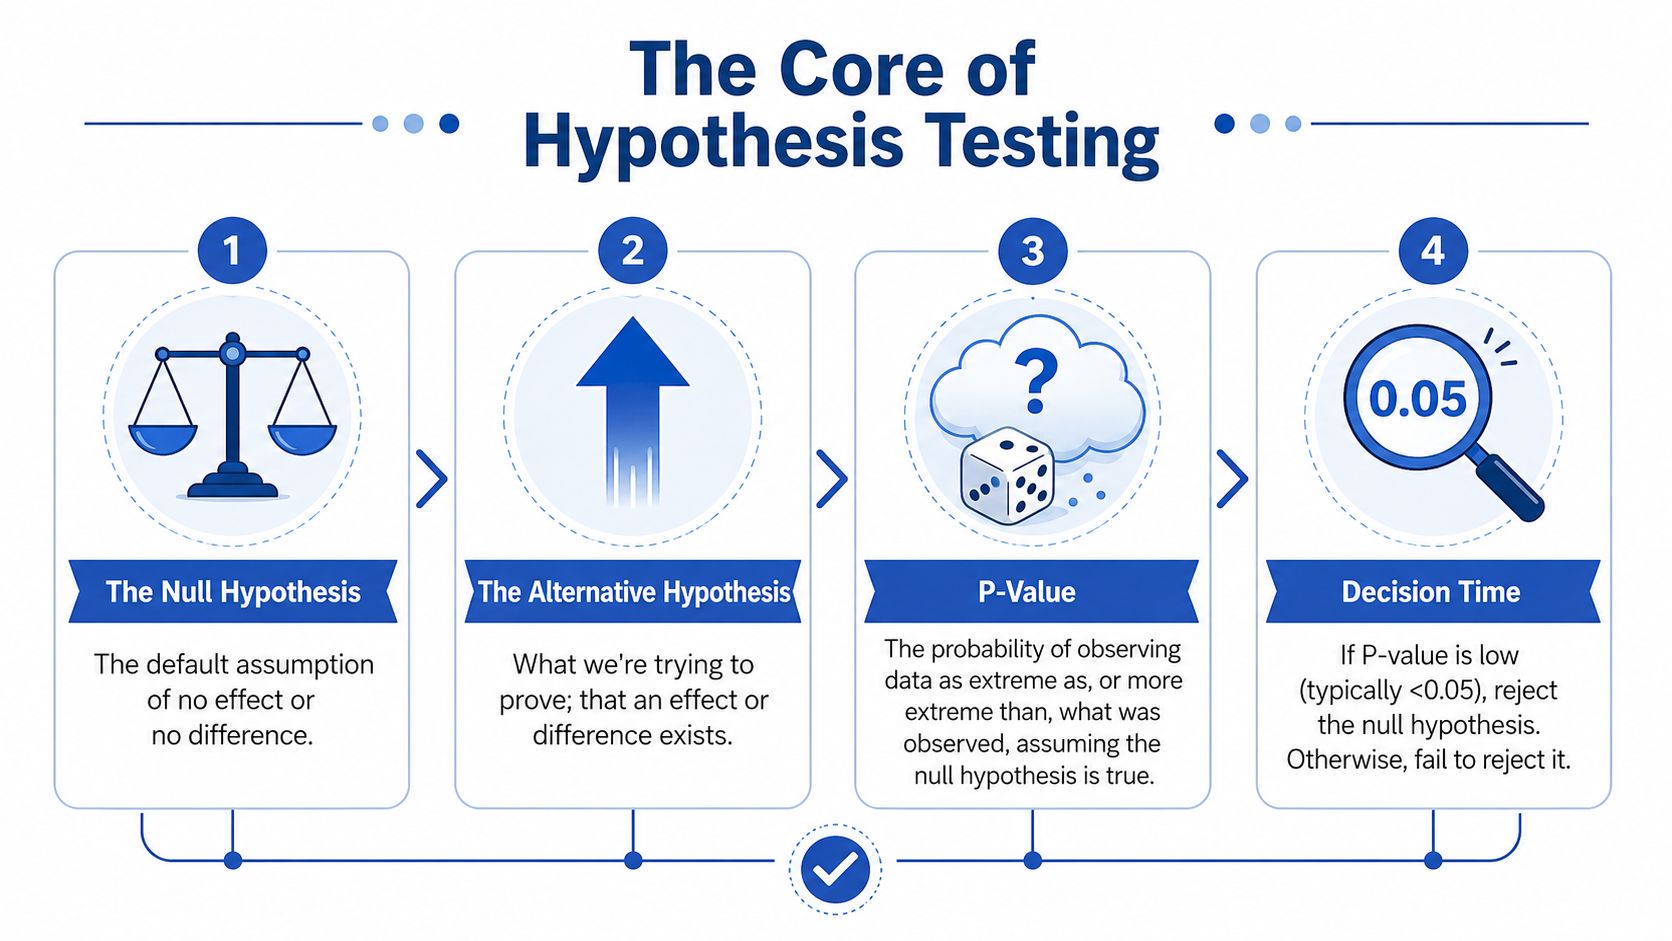
What the p-value is actually doing
The p-value is one of the most misunderstood ideas in analytics.
It does not tell you the probability that your new page is better. It does not tell you the probability that the null hypothesis is true. What it asks is narrower and more technical:
If there were really no effect, how surprising would your observed result be?
If the answer is “very surprising”, the evidence pushes you away from the null hypothesis. If the answer is “not very surprising”, the data don't give you much reason to reject it.
A plain-language example
Suppose Version B of your page gets more add-to-cart clicks than Version A. You run the numbers and get a small p-value. That means this pattern would be relatively unlikely if there were no difference between the versions.
That's why analysts often use a threshold such as p < 0.05 as a rule for rejecting the null hypothesis. It's a decision rule, not a truth machine.
Here's the practical sequence:
- State the null hypothesis: “The redesign has no effect.”
- Collect data: Run the test without peeking every hour and changing course.
- Calculate a p-value: Measure how compatible your observed result is with the null.
- Make a decision: Reject the null or fail to reject it.
Practical rule: Treat the p-value as evidence against the default assumption, not as a confidence score for your favourite idea.
Why “fail to reject” matters
This phrase annoys people because it sounds vague. But it's precise. If your p-value doesn't cross your chosen threshold, you haven't proved there is no effect. You've only concluded that your data don't provide strong enough evidence against the null.
That distinction matters in business. A test can be inconclusive because nothing changed. It can also be inconclusive because the test was noisy, too short, or poorly set up. Statistical significance testing helps you judge evidence. It doesn't remove the need for judgement.
Understanding Errors Power and Effect Size
Even a well-run test can reach the wrong conclusion. Statistical significance testing is about managing that risk, not eliminating it.
Two classic mistakes sit underneath most test decisions. A Type I error is a false positive. You think the new experience helped, but it didn't. A Type II error is a false negative. You conclude there's no meaningful improvement, but you've missed one that was really there.
For a CRO team, both errors are expensive in different ways. False positives waste rollout effort. False negatives bury genuine gains.
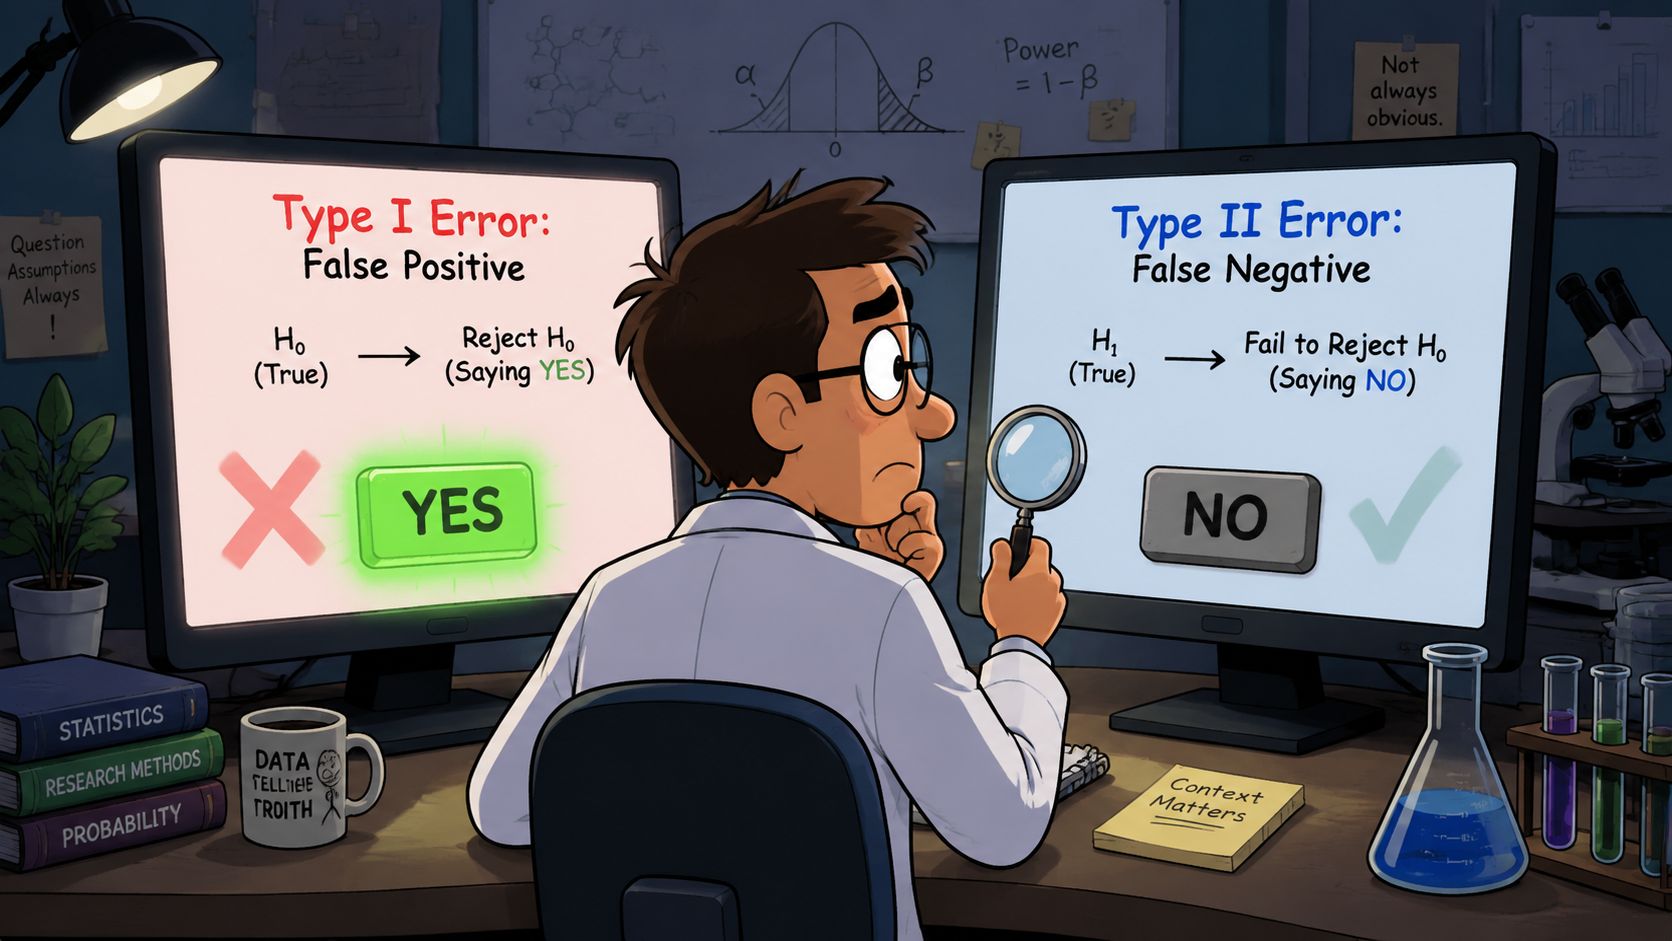
Type I and Type II errors in business terms
A simple way to think about them:
- Type I error: You launch the new PDP layout, update creative, and brief support. Weeks later, nothing improved. The test told you there was a winner when there wasn't.
- Type II error: You end the experiment too early, call it a wash, and leave money on the table because the variant was better.
- Neither error is moral failure: They're built into decision-making under uncertainty.
What power means
Power is your test's ability to detect a real effect when one exists. Higher power means you're less likely to miss a genuine signal.
You don't need to be a statistician to care about power. If your test has low power, it becomes much harder to tell whether a flat-looking result reflects reality or just insufficient evidence. Low power also creates another problem. Recent research in 2026 found that statistically significant results from low-power analyses are likely to overestimate the true effect, which is highly relevant for experimentation and survey work (research on low-power significant results).
That's one reason binary thinking causes trouble. Teams often treat “significant” as “safe to believe” and “not significant” as “nothing happened”. Real interpretation is messier.
Effect size is the business lens
If the p-value tells you whether the result is unlikely to be random under the null, effect size tells you how big the difference is.
That's the number business teams should care about after the initial test decision. A tiny gain may be real but commercially trivial. A larger gain may justify implementation effort, broader rollout, or follow-up tests.
Think of it this way:
| Concept | Question it answers | Why marketers should care |
|---|---|---|
| P-value | Is the observed result hard to explain by chance under the null? | Helps judge whether the pattern is likely to be noise |
| Power | Could this test realistically detect an effect if one exists? | Helps avoid false reassurance from weak tests |
| Effect size | How large is the difference? | Determines whether the result is worth action |
A result can clear a statistical threshold and still fail a business threshold.
A better habit for reading test results
When you review an experiment, don't ask only “Did it reach significance?”
Ask these instead:
- Was the test capable? Weak design creates weak evidence.
- How large is the effect? A real change might still be too small to matter.
- What would rollout cost? Even a real gain can be a poor trade if implementation is complex.
- Would we still care if the effect were slightly smaller? That question keeps optimism in check.
Many teams mature when they stop treating statistical significance testing as a finish line and start using it as one input into a commercial decision.
Choosing the Right Statistical Test
The phrase “run a significance test” sounds singular, but there isn't one universal test for every problem. The right method depends on the kind of data you have and the question you're asking.
If you use the wrong test, the result can look tidy while the logic underneath is shaky. That's why test selection matters as much as interpretation.
Start with the shape of the data
A practical shortcut is to ask what kind of outcome you're measuring.
If the outcome is categorical, such as clicked or didn't click, converted or didn't convert, you're comparing proportions. If the outcome is continuous, such as average order value or time on page, you're comparing numerical measurements.
Then ask how many groups you're comparing. Two versions call for one kind of test. Several versions call for another.
Quick Guide to Common Statistical Tests
| Test Name | When to Use It | Example |
|---|---|---|
| Chi-square test | Comparing categorical outcomes between groups | Did Version A and Version B produce different conversion rates? |
| t-test | Comparing the average of a numeric measure between two groups | Did the new checkout change average order value? |
| ANOVA | Comparing averages across three or more groups | Which of several page layouts produced the highest average basket value? |
| Permutation test | When you want a flexible approach with fewer assumptions | Comparing outcomes when data are irregular or you want a resampling-based check |
A simple decision framework
Use this mental checklist before opening your stats tool:
What is the metric?
Conversion rate behaves differently from revenue per visitor.How many groups are in play?
Two groups is not the same analysis problem as several variants.Are the assumptions reasonable?
Some tests assume certain data behaviour. If those assumptions look doubtful, a permutation approach may be more reliable.
The common ecommerce cases
For many A/B tests in ecommerce, a chi-square test is a sensible choice because you're often comparing proportions. Did more visitors click? Did more sessions convert?
If you're comparing average order value, a t-test is often the more natural fit because you're dealing with means rather than simple yes-or-no outcomes.
If your team is testing multiple versions of a page or offer at once, ANOVA becomes useful because it's designed for comparing more than two groups without forcing you into a pile of pairwise tests.
Why this matters more than teams think
A lot of bad experimentation doesn't come from bad intentions. It comes from a mismatch between metric and method. Someone exports a report, runs a familiar formula, and gets a clean-looking answer.
But the statistical test has to match the business question. If your question is “Did more people convert?”, use a method suited to proportions. If your question is “Did spend per order change?”, use a method suited to averages.
That discipline keeps your testing programme credible. It also makes your decisions easier to defend when leadership asks why one result counted and another didn't.
A Practical Walkthrough of an Ecommerce A/B Test
Let's make this concrete with a realistic store experiment.
A team wants to know whether changing the product gallery from a carousel to a stacked grid will improve Add to Cart behaviour. That's a classic ecommerce test. The current design may look elegant, but customers might engage better when product images are easier to scan.
Step one is framing the decision
The null hypothesis is simple: the gallery format has no effect on add-to-cart clicks.
The team decides in advance that it will use a significance threshold of 0.05, then runs the test and analyses the result using a chi-square test, which fits a comparison of click rates between two versions.
This kind of setup is standard in Shopify experimentation work. If you need the implementation side as well as the analysis side, Shopify A/B testing services are one route teams use to structure experiments properly from the start.
Then the results arrive
The control version produces a click rate of 4.5%. The grid variant produces 5.0%. The test output returns a p-value of 0.02, and the observed effect is a 0.5% absolute increase in conversions.
Because 0.02 is below 0.05, the team rejects the null hypothesis. In statistical terms, the result is significant. The data suggest the difference is unlikely to be due to chance alone.
That's the formal interpretation. But the business interpretation is where the value sits.
The team should still ask whether the observed lift is worth rollout effort, whether the gain holds across device types, and whether any downstream metric worsened. That's how you stop a statistically tidy answer from becoming a commercially sloppy decision.
What a thoughtful readout sounds like
A strong analyst wouldn't say, “The test won, ship it.”
They'd say something closer to this:
- The variant outperformed the control on the target metric
- The result met the pre-set threshold for statistical significance
- The observed gain appears commercially relevant enough to consider rollout
- We should still verify there's no hidden trade-off elsewhere in the journey
That style of communication builds trust because it reflects uncertainty without becoming indecisive.
Here's a visual walkthrough if you want to see the process in a more applied format:
Good experimentation teams don't just ask whether a variant won. They ask whether the win is reliable, meaningful, and operationally worth keeping.
Why this example matters
This is the kind of case that makes statistical significance testing feel useful rather than academic. You start with a practical question, choose the right metric, define the null hypothesis, run the right test, and interpret the output with business context.
That final part matters most. The p-value helped establish that the result wasn't likely to be random noise under the null. The effect size and rollout context told the team whether it was worth acting on.
Beyond the P-Value Common Pitfalls and Best Practices
Many teams treat a significant result as the end of the conversation. It's usually the start.
The biggest practical mistake is confusing statistical significance with practical significance. A result can be real in the statistical sense and still too small to matter in day-to-day operations. The UK's Office for National Statistics routinely warns that statistical significance is partly a function of sample size and can be reached with very large datasets even for small changes, which is exactly why teams must check whether an effect is large enough to matter operationally (discussion of practical significance and sample size).
That point lands hard in marketing. If a tiny change clears the threshold but takes design time, developer time, QA effort, and stakeholder attention, the right choice may be to do nothing.
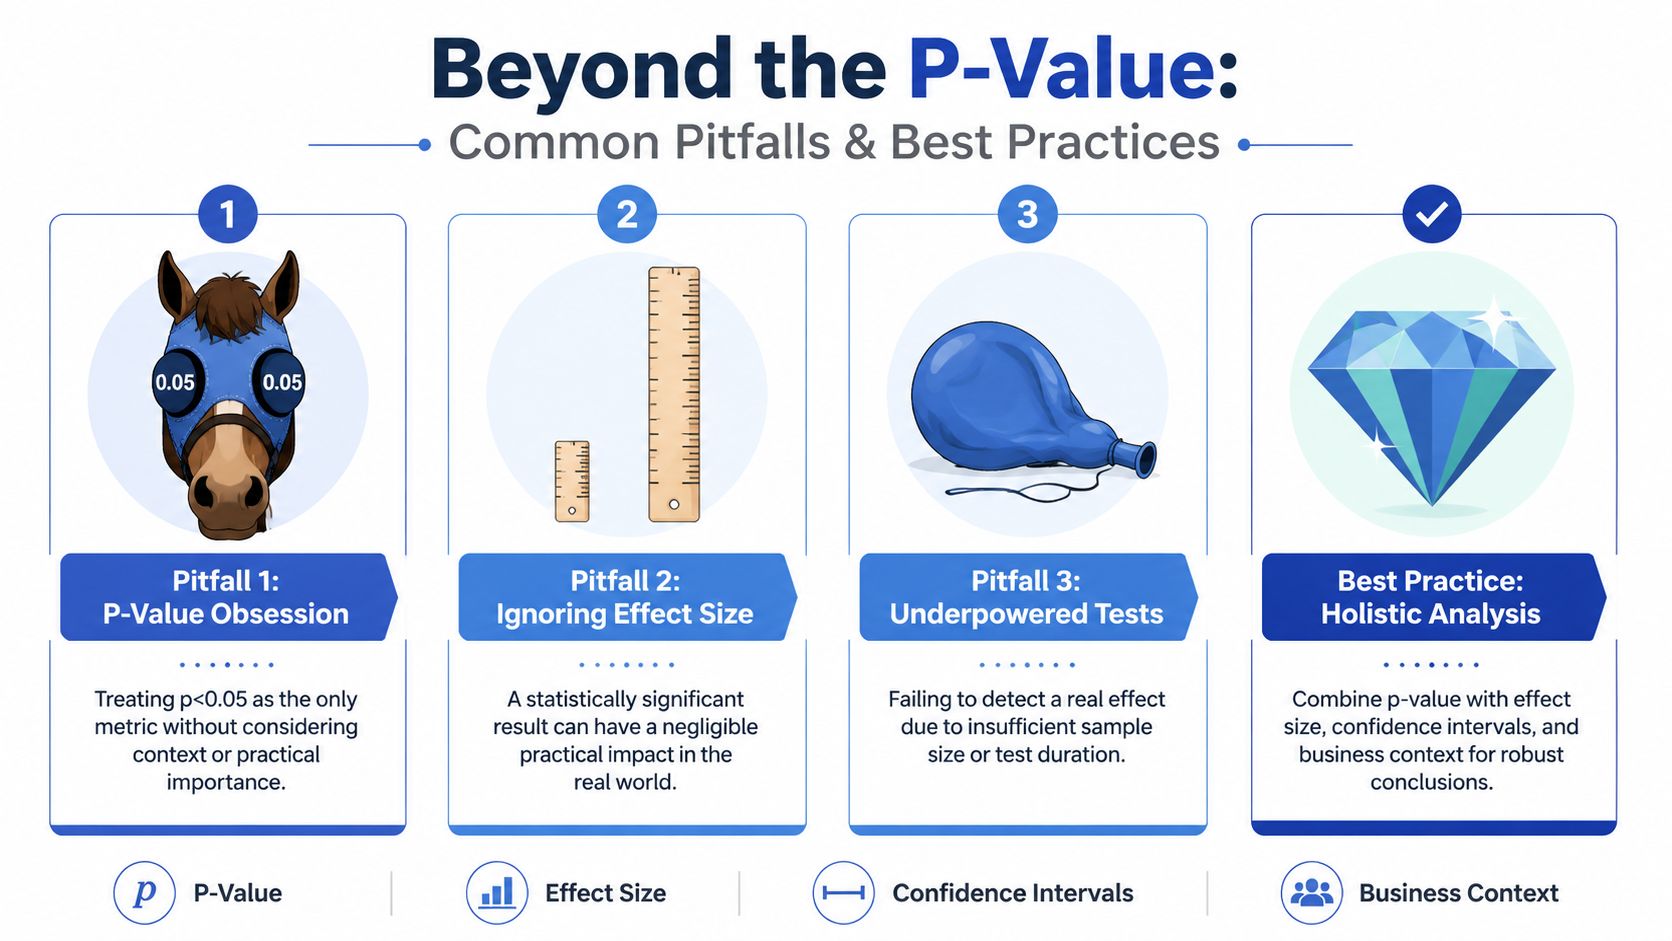
Common ways teams fool themselves
Some patterns show up again and again:
- Stopping when the chart looks good: Early peeking encourages overconfidence.
- Running many tests and celebrating one winner: That inflates the chance of false positives.
- Ignoring effect size: A result can be “real” and still not justify rollout.
- Treating non-significance as proof of no effect: Sometimes the test just wasn't informative enough.
Better habits that hold up under pressure
If you want stronger decisions, tighten the process before the data arrive.
| Best practice | Why it helps |
|---|---|
| Define the hypothesis in advance | Prevents vague, post-hoc storytelling |
| Set the sample plan before launch | Reduces the temptation to stop opportunistically |
| Review effect size with the p-value | Keeps business relevance in view |
| Check confidence intervals | Helps you judge uncertainty around the estimate |
| Limit repeated unplanned tests | Lowers the risk of false confidence |
Don't ask only, “Is this significant?” Ask, “Would we still care if this exact result held next quarter?”
The real decision standard
For CRO and marketing teams, the useful standard isn't “Did we get below the threshold?” It's “Do we have enough evidence of a meaningful effect to justify action?”
That combines statistics with judgement. It respects the data without surrendering to them. And it prevents the all-too-common outcome where a team ships tiny wins, misses big ones, and can't explain why performance still feels flat.
Making Smarter Data-Driven Decisions
The core value of statistical significance testing is not that it gives you certainty. It gives you a disciplined way to make decisions when certainty isn't available.
Used properly, it helps you separate random movement from credible evidence. But the strongest teams don't stop there. They pair statistical thinking with commercial judgement. They ask whether the observed effect is large enough to matter, whether the test was capable of detecting a real difference, and whether the rollout cost makes sense.
That's the shift from reporting numbers to making decisions.
If your team wants a broader framework for turning testing insights into better store performance, this guide to ecommerce conversion optimization is a useful next read. It connects experimentation with the wider work of improving product pages, checkout flows, and customer journeys.
Statistical significance testing works best when you treat it as a decision aid, not a verdict machine. The best question isn't only “Is this result real?” It's also “Is this result worth acting on?”
If you're improving a Shopify store and need help turning test results into practical UX, CRO, and development decisions, Grumspot works on design, experimentation, audits, and build work for ecommerce teams.
Let's build something together
If you like what you saw, let's jump on a quick call and discuss your project

Related posts
Check out some similar posts.

- seasonal demand forecasting
Master seasonal demand forecasting with our guide. Source data, select models, & integrate with Shop...
Read more