Customer Lifetime Value Calculation: Shopify Guide 2026
- customer lifetime value
- clv calculation
- ecommerce analytics
- shopify metrics
- ltv cac ratio
Launched
June, 2026
Paid acquisition is getting more expensive. Your Shopify dashboard shows sales, but it doesn't tell you whether those customers will come back, buy again, or disappear after one discount-driven order.
That's where customer lifetime value calculation stops being a finance exercise and becomes an operating metric. If you sell online, you need a defensible view of what a customer is worth over time, not just what they spent today. Otherwise, you'll set budgets on hope, overvalue low-quality channels, and underinvest in retention.
For Shopify merchants, the challenge isn't only choosing a formula. It's pulling the right inputs from Shopify, deciding how much historical data you can trust, and avoiding distorted numbers after migrations, seasonal peaks, or channel mix changes. The useful version of CLV is the one you can use to make decisions.
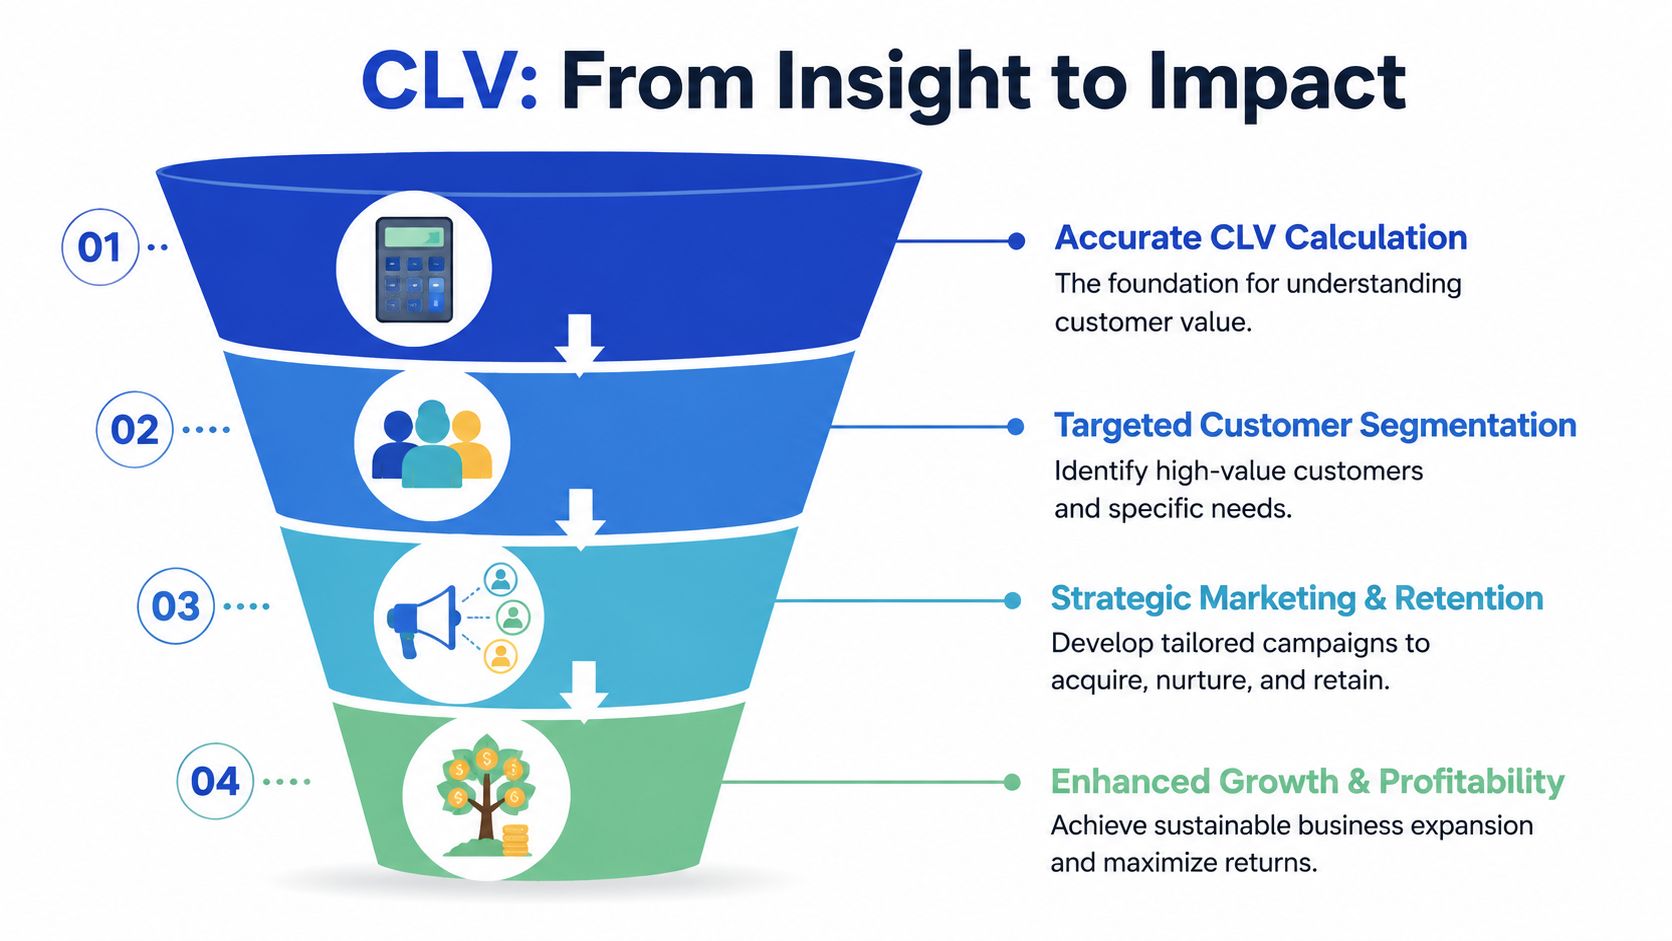
Why Customer Lifetime Value Is Your Most Important Metric
Most merchants start with the wrong question. They ask, “What did we make from this campaign?” The better question is, “What kind of customers did this campaign bring us?”
A channel that drives cheap first orders can still be a poor investment if those buyers never return. Another channel can look expensive on day one and still be the better bet because those customers reorder, subscribe, or buy higher-margin products later. Customer lifetime value is the metric that makes that difference visible.
CLV changes how you judge growth
CLV tells you how much room you have to spend on acquisition without breaking the model. It also forces you to separate revenue from durable profit. If your paid social campaign brings in a flood of one-time bargain hunters, the top-line number may look healthy while the long-term economics are weak.
This is why CLV sits next to CAC, not somewhere deep in a reporting deck. If you want to measure ad campaign profitability properly, you need more than immediate return. You need to know whether the customers acquired are likely to create value beyond the first transaction.
CLV is the closest thing ecommerce has to a reality check. It shows whether growth is compounding or just being purchased month by month.
What CLV helps you decide
Used properly, customer lifetime value calculation affects day-to-day decisions across the business:
- Paid media budgets decideable by ceiling, not guesswork. You know when Meta, Google, affiliates, or creators are bringing in customers worth paying for.
- Retention priorities become clearer. You stop treating every buyer the same and focus on the groups that justify more attention.
- Offer strategy improves. Discount-heavy acquisition may look less attractive when you track what happens after the first order.
- Forecasting gets grounded in customer behaviour, not only traffic projections.
Merchants who ignore CLV usually end up reacting to symptoms. They cut ad spend when first-order efficiency drops, or they pile money into channels with weak repeat behaviour because the platform attribution looks clean enough.
The practical version matters more than the perfect one
You don't need a complicated model on day one. You do need a model that reflects how your store operates. For some brands, a simple historical calculation is enough to set guardrails. For others, especially stores with subscriptions, seasonal surges, or mixed acquisition channels, the simple version starts to mislead quickly.
The rest of the work is straightforward. Pull the right data, choose the right formula, and stop using one average to explain a customer base that clearly behaves in different ways.
Calculating Your Foundational CLV Metrics
A Shopify merchant pulls last month's reports, sees strong top-line revenue, and assumes customer value is healthy. Then paid acquisition gets more expensive, returning customer rate slips, and the business is suddenly budgeting off a number that never reflected margin, repeat behaviour, or data quality in the first place.
Start with a version of CLV you can calculate accurately from systems you already trust. For most Shopify stores, that means building one clean baseline from Shopify data, then improving it once the inputs are stable.
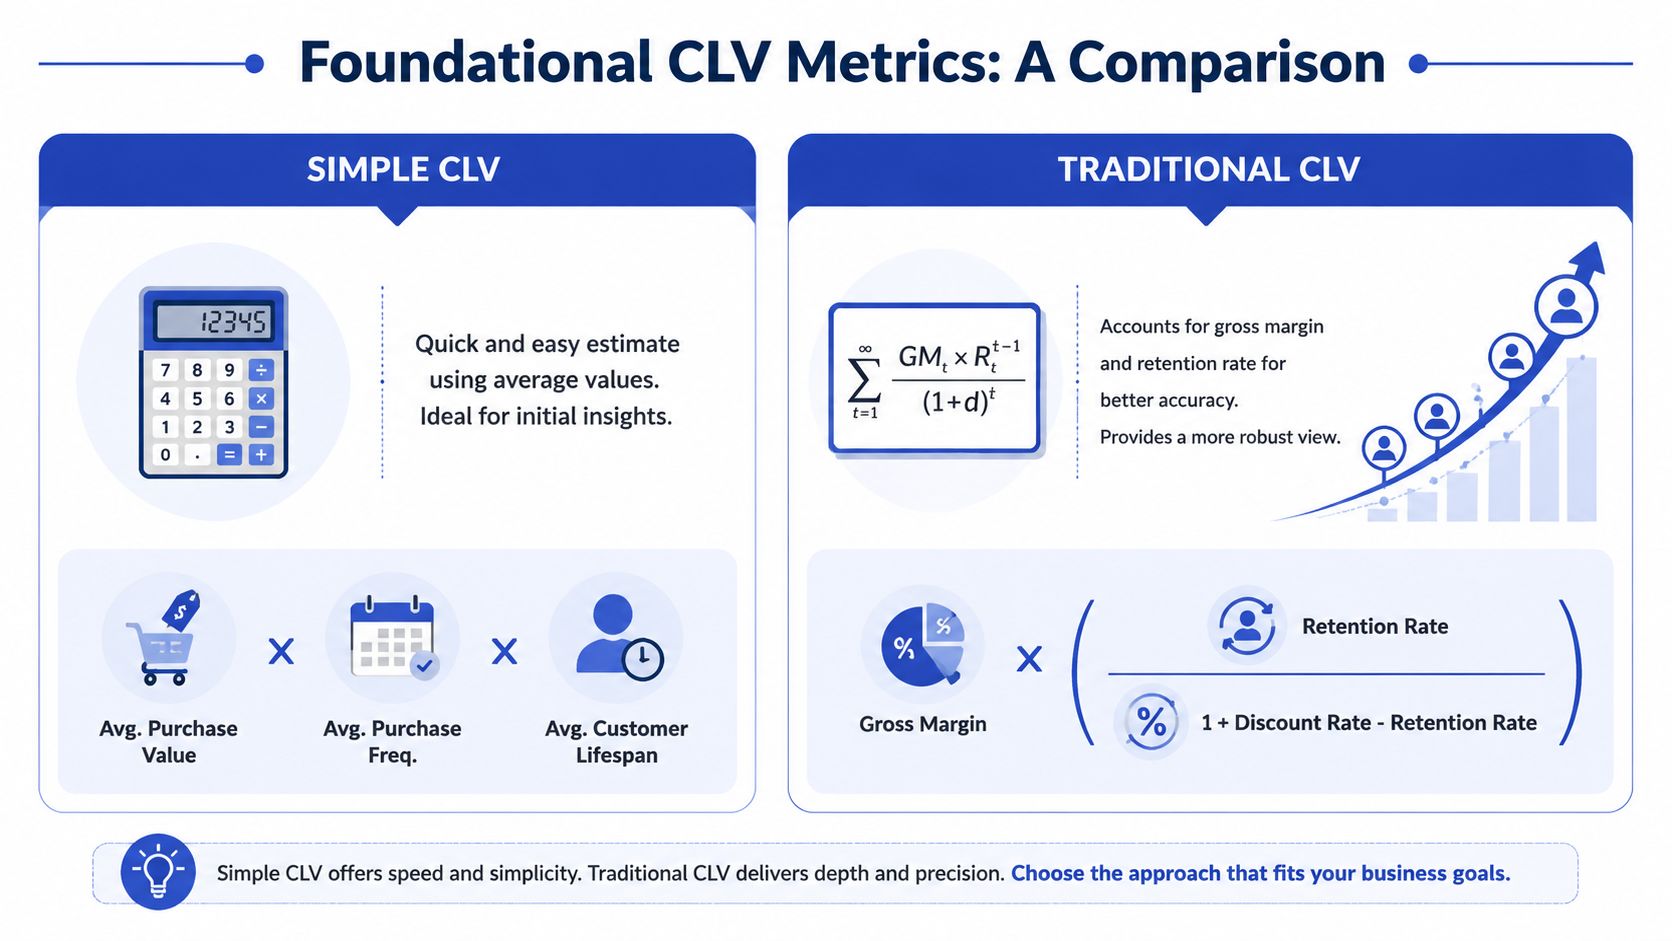
The simple historical formula
The standard starting point is:
CLV = average order value × purchase frequency × customer lifespan
It is still widely used in ecommerce because it is fast to build and easy to explain. Subscription businesses often use a related churn-based model instead. A common example uses $80 in average monthly revenue and 4% monthly churn to produce $2,000 CLV, as outlined in a guide to calculating lifetime customer value and in the original industry explanation from Kissmetrics.
For Shopify merchants, this simple model works best as a baseline, not a final answer.
Average order value comes straight from Shopify analytics. Purchase frequency can be calculated from customer order history, either in Shopify reports, ShopifyQL, or an analytics app like Lifetimely. Customer lifespan is where merchants usually get sloppy. They guess, they mix time windows, or they use post-migration data without checking what was lost in the move from WooCommerce, Magento, or a previous Shopify instance.
That creates bad CLV fast.
Use the simple model when:
- You need a starting benchmark for CAC guardrails.
- Your data setup is still maturing and you want a clean first pass.
- You are validating reporting before building segment-level models.
Its limits are clear:
- It treats revenue like contribution.
- It blends high-repeat and low-repeat customers into one average.
- It gets distorted by heavy promo periods, first-order discount campaigns, and incomplete historical data.
Seasonality is a common trap. A brand with a huge Q4 can make annualised purchase frequency look stronger than it really is. Before trusting any change in repeat behaviour, check whether it is real or just noise from a short time window. This is exactly the kind of problem that statistical significance testing for ecommerce decisions helps you handle.
The margin-aware formula
If the number is going to influence acquisition budgets, margin has to be in the model.
A practical ecommerce formula is:
CLV = (Average Order Value × Gross Margin × Purchases per Year) ÷ Annual Churn Rate
This version is much more useful in real operating decisions because it reflects what the customer contributes, not just what they spend. That matters for Shopify stores with wide product margin differences, bundled offers, or aggressive discounting.
The inputs look simple, but each one needs care:
- Pull average order value from Shopify for the same period you are analysing.
- Estimate gross margin using actual product or category economics, not a blended finance assumption if your catalogue varies a lot.
- Calculate purchases per year from order history, ideally by customer segment.
- Convert churn to the same time frame as every other input.
Time alignment is where merchants make avoidable mistakes. Monthly churn with annual purchase frequency will give a false answer. So will comparing a 90-day cohort against a full-year AOV average.
For many Shopify stores, gross margin is not available cleanly inside core Shopify reporting. That usually means one of three approaches: export order and product data to a spreadsheet, combine Shopify with inventory or finance data, or use an app that can layer margin into customer reporting. Lifetimely is a common starting point. Peel can work well for stores that want deeper analysis across Shopify and ad platforms. The right choice depends on whether the team needs quick visibility or a more flexible data model.
A separate note for subscription and hybrid stores
Stores with subscriptions, memberships, replenishment products, or subscribe-and-save should usually track recurring and one-time buyers separately.
The shorthand formula is:
CLV = average monthly revenue per account / monthly churn rate
It is useful because it maps closely to how recurring revenue behaves. But hybrid Shopify brands often force every customer into one blended CLV figure and lose the signal. A one-time gift buyer and a subscriber on a replenishment SKU do not belong in the same model if the goal is better budgeting.
A cleaner setup is to calculate:
- one CLV model for one-time customers
- one for subscribers or members
- one blended view only for executive reporting
That extra step prevents bad channel decisions, especially if subscription customers come in through a different offer, landing page, or retention flow than standard ecommerce buyers.
Where to get the data in Shopify
For a practical first build, pull from these sources:
| Metric | Best Shopify data source | Common issue |
|---|---|---|
| Average order value | Shopify Analytics or sales reports | Includes discounted orders that may not reflect normal buying behaviour |
| Purchase frequency | Customer order history, export, or app reporting | New-customer surges can temporarily depress the average |
| Customer lifespan | Historical customer export or retention app | Often incomplete after replatforming or account merges |
| Gross margin | Product cost data, ERP, or finance system | Shopify-only numbers are often missing true landed costs |
| Churn or repeat rate | Subscription app, retention app, or custom analysis | Definitions vary by business model |
Post-migration data gaps need special handling. If order history before the move is incomplete, do not pretend lifespan is settled. Use a shorter labelled observation window, document the break in continuity, and avoid comparing migrated and native Shopify cohorts as if they were identical.
A practical starting point
Most stores do not need a complicated CLV model first. They need one that survives scrutiny.
| Store situation | Best starting method | Why |
|---|---|---|
| Newer store with limited reporting confidence | Simple historical CLV | Fast baseline with fewer moving parts |
| Established ecommerce brand with stable reorder data | Margin-adjusted CLV | Better for CAC limits and forecast quality |
| Subscription-heavy catalogue | Revenue or margin over churn | Closer to recurring customer economics |
| Recently migrated store with incomplete history | Short-window historical CLV | More honest than overstating customer lifespan |
If you build one CLV model this week, make it clean, time-aligned, and tied to data you can verify inside Shopify or your reporting stack. That version is more useful than an ambitious spreadsheet built on missing pre-migration orders, promo-skewed averages, or margin assumptions nobody has checked.
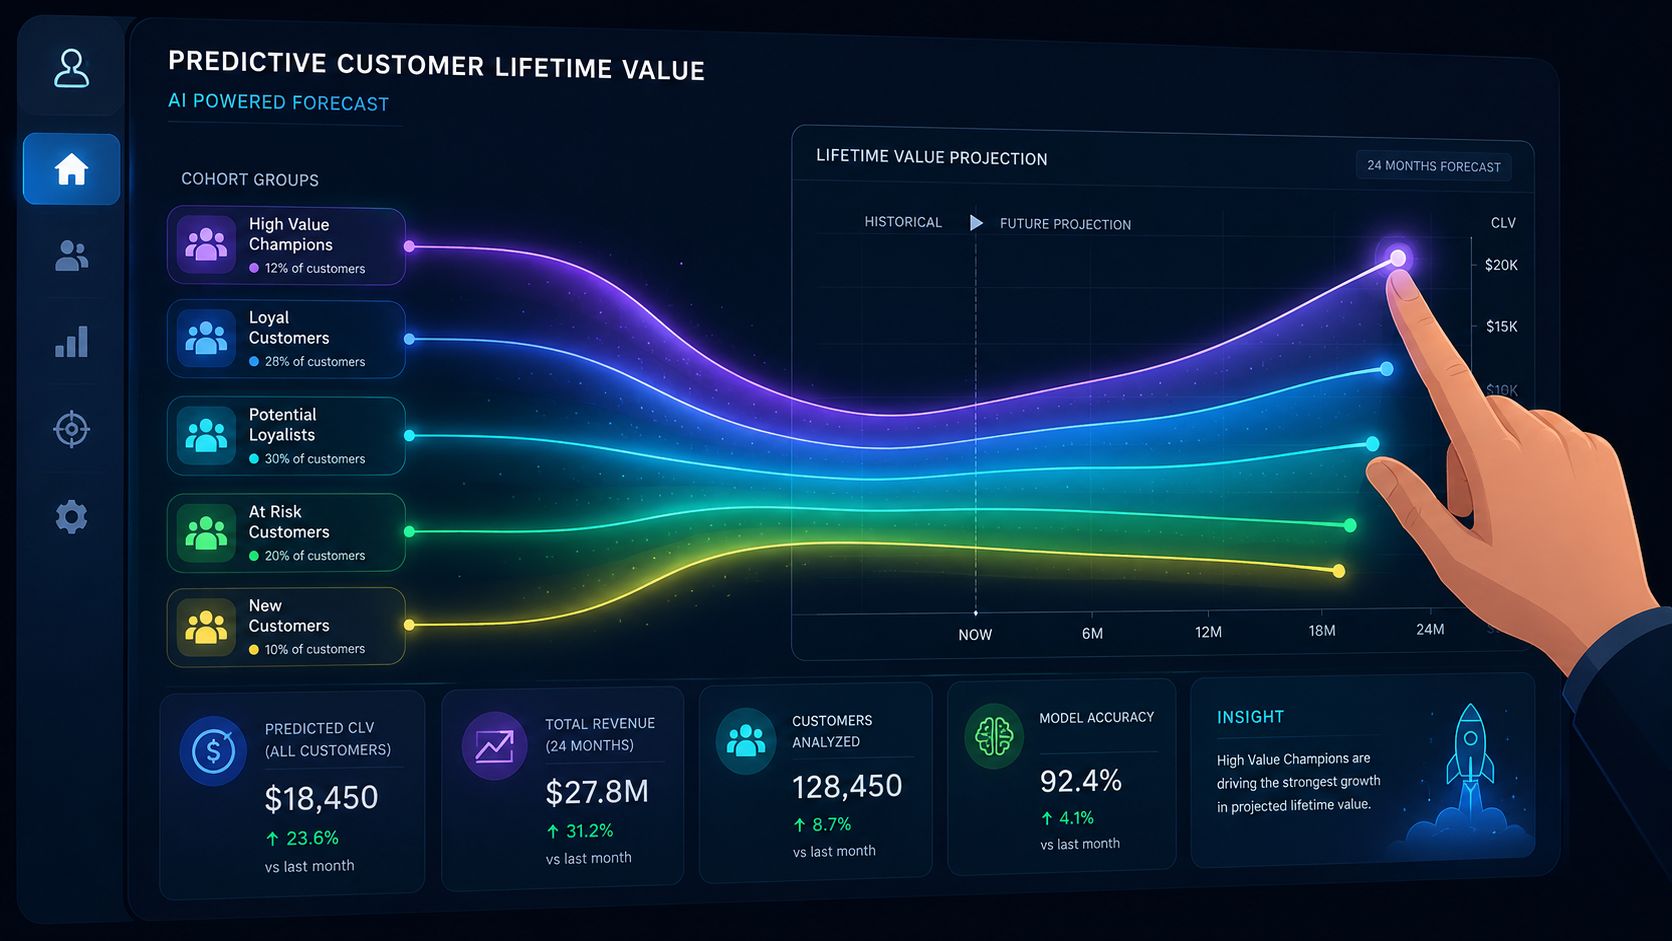
Advancing to Predictive and Cohort-Based CLV
Historical averages are useful until they start hiding the very thing you need to know. A blended CLV number can make a customer base look stable even when one acquisition channel is improving and another is deteriorating.
That's why serious Shopify operators move from single-average CLV to cohort analysis and predictive CLV.
Why cohorts beat blended averages
A cohort groups customers by a shared trait, usually first purchase month, acquisition channel, campaign, or product entry point. Instead of asking, “What is our average CLV?”, you ask better questions:
- Did customers acquired in Q4 behave differently from spring cohorts?
- Do Google Shopping customers repeat at the same rate as email-captured customers?
- Does the first product bought predict later value?
Those are the questions that improve budget allocation.
For UK Shopify Plus merchants, there's a relevant operational nuance here. Average customer lifespan should be calculated as 1 ÷ churn rate only when churn is stable. In volatile markets, a weighted average of the last 4 quarters yields a 15% higher accuracy rate, and models that incorporate gross margin and channel-specific churn are 85% accurate in forecasting Year-1 revenue, while simplified models drop to 62%, according to the Department for Business and Trade.
That gap is exactly why channel-level cohort work matters. If different cohorts churn differently, one average lifespan number won't hold up.
Predictive CLV is useful when history is thin or distorted
Predictive CLV matters most when your past data isn't clean enough to rely on by itself. That's common after a Shopify migration, a major catalogue change, or a period dominated by aggressive promotions.
In those situations, historical averages can be backward-looking in the worst way. They describe what happened under old conditions, not what your current customer mix is likely to do next.
A practical predictive setup often includes:
- Acquisition source as a core variable
- First product purchased or first basket type
- Discount usage on first order
- Time to second purchase
- Subscription enrolment or account creation
- Customer support or return behaviour, where available
If your team is testing whether one cohort outperforms another, use proper significance checks rather than trusting small-sample swings. This primer on statistical significance testing is worth keeping close when channel comparisons start influencing budget.
The trade-off
Predictive models are not magic. They can overfit. They can be built on poor attribution. They can also create false confidence if the inputs are inconsistent.
What works is a layered approach:
- Keep a simple baseline CLV.
- Break it into cohorts by channel or entry product.
- Add predictive logic only where the extra complexity changes a real decision.
A short explainer can help if your team needs a visual overview before building the model:
The point isn't sophistication for its own sake. The point is getting closer to how customers behave, especially when your store has multiple audiences, multiple traffic sources, and uneven retention patterns.
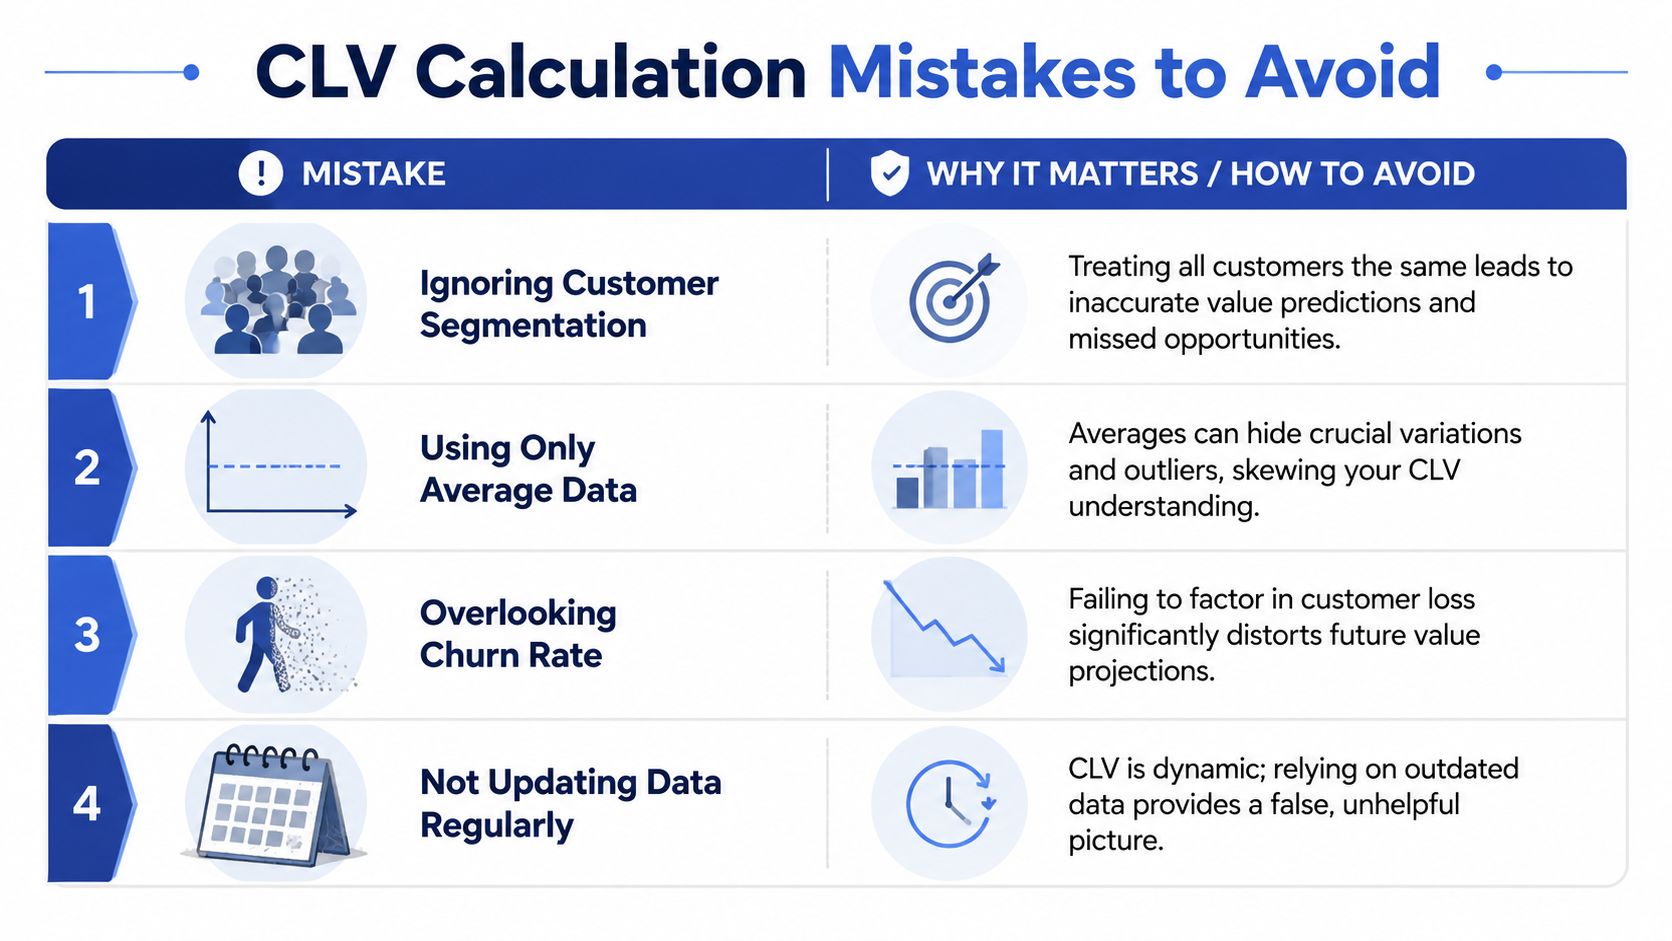
Common CLV Calculation Mistakes to Avoid
Most bad CLV models fail in ordinary ways. The spreadsheet looks tidy, the number seems plausible, and the business starts using it for budget decisions. That's where the damage happens.
Mixing time units
This is one of the most expensive errors because it often goes unnoticed. When businesses calculate purchases per month but lifespan in years without conversion, the result can be wrong by a systematic 10-12x factor, a pitfall highlighted by the ONS.
It sounds basic, but it happens constantly in ecommerce reporting. A marketer exports purchase frequency from one dashboard, finance supplies lifespan from another, and nobody checks whether the units match.
Use one time frame across the whole model. Annual is usually easiest for stores with strong seasonality.
Treating revenue like profit
Revenue-only CLV is not useless, but it becomes dangerous when teams use it to set acquisition ceilings. If one product line carries healthy margin and another is heavy on fulfilment cost, return rate, or discounting, a revenue-based average can make weak customers look acceptable.
That's why the stronger method is the retention-based CLV with margin adjustment, which achieved a 91% success rate in UK pilot studies in the same ONS-backed guidance above.
A customer who generates revenue isn't automatically a valuable customer. Margin decides whether the relationship funds growth or drains it.
Using one churn assumption for everyone
A blended churn rate almost always hides something important. New customers churn differently from loyal ones. Paid social buyers often behave differently from email-acquired buyers. Holiday cohorts often behave differently from full-price cohorts.
If you use a single churn figure across the entire customer base, the model gets neat at the exact moment it becomes less useful.
Letting stale data run the model
CLV is not a set-and-forget number. Product mix changes. Shipping costs move. Promotions alter reorder behaviour. A migration can break continuity in order history and customer IDs.
A practical review checklist helps:
- Recheck gross margin inputs when pricing, shipping, or fulfilment costs change.
- Update churn and repeat purchase rates after large campaign pushes or catalogue shifts.
- Separate abnormal periods such as major clearance phases or migration months.
- Audit customer identity continuity if data came from another platform or ERP.
A quick test for whether your model is trustworthy
Ask four blunt questions:
| Check | If the answer is no |
|---|---|
| Are all inputs on the same time basis? | The calculation is structurally unreliable |
| Does the model account for gross margin? | Acquisition limits may be too high |
| Are cohorts separated by meaningful differences? | High and low value customers are being blended |
| Is the data current enough to reflect present trading conditions? | The model may describe a business that no longer exists |
Bad CLV numbers don't just create analytical noise. They push merchants to overpay for acquisition, misjudge retention quality, and protect channels that should have been cut earlier.
Using CLV to Drive Growth and Profitability
A Shopify brand finishes the month with strong top-line revenue, paid social looks healthy, and new customer volume is up. Two months later, margin is tighter, repeat rate is flat, and the customers bought on discount have not come back. The store did not have a traffic problem. It had a customer quality problem.
That is where CLV earns its keep. A customer lifetime value calculation matters only when it changes spend limits, retention priorities, and merchandising choices.
Use CLV to set acquisition guardrails
CLV gives paid acquisition a ceiling. Without it, teams scale channels on first-order ROAS, then wonder why contribution margin disappears after agency fees, discounts, and returns.
A common rule of thumb is to keep lifetime value comfortably above acquisition cost. The exact ratio varies by margin profile, payback tolerance, and cash position, but the operating principle is simple. Stores with healthy repeat purchase behaviour can afford a higher CAC. Stores with weak second-order rates cannot.
For Shopify merchants, this gets practical fast:
- A subscription skincare brand can usually bid more aggressively because reorder behaviour is built into the model.
- A trend-led fashion store with heavy sale activity needs tighter CAC limits because many first-time buyers never return at full price.
- A store coming off a migration should be careful. If historical repeat data is incomplete, acquisition targets often get set too high.
The mistake is treating all new customers as equally valuable. They are not. A customer acquired through branded search, a creator campaign, and a clearance ad may all cost different amounts and behave very differently over the next six months.
Use CLV to segment customers properly
Retention gets better when teams stop sending the same offers to everyone.
For Shopify stores, the most useful segments usually come from fields you can reliably pull and trust: first product purchased, discount usage, sales channel, subscription status, location, and time of first purchase. Those are not abstract analytics dimensions. They point to real operating decisions.
Useful segmentation lenses include:
- First product purchased
- Acquisition channel
- Discounted versus full-price first order
- One-time versus subscription enrolment
- Geography or fulfilment region
A practical example. If customers who first buy a refill product on full price reorder twice as often as customers who first buy a discounted bundle, those groups should not sit in the same welcome and retention logic. One group may justify early-access launches and replenishment reminders. The other may need tighter discount control and a stronger post-purchase education sequence before you spend more to retain them.
This is also where Shopify merchants often miss easy wins. They build segments in Klaviyo or a CLV app, but never pass the learning back to media buying, offer strategy, or merchandising.
Use CLV to shape merchandising and AOV strategy
Some products bring in better customers, not just more orders.
That distinction matters. A hero SKU with a modest first-order margin can still be a strong acquisition product if it leads to repeat purchases in a high-margin category. On the other hand, a heavily discounted bundle can inflate conversion rate while dragging down future value if it attracts promotion-only buyers.
CLV helps merchants judge product strategy on customer quality, not just immediate sales. It also sharpens AOV work. Tactics like bundles, threshold offers, and cross-sells should increase order value without pulling in lower-quality customers or training existing ones to wait for incentives. This guide on how to increase average order value pairs well with CLV analysis because stronger baskets only help if they support profitable repeat behaviour.
A lot of stores get this wrong during peak season. They chase larger baskets with aggressive discounting, then spend Q1 trying to recover margin from cohorts that were never likely to buy again.
What good teams do differently
They use CLV to make trade-offs across functions, not to produce one headline number for leadership.
| Decision area | Weak use of CLV | Strong use of CLV |
|---|---|---|
| Paid acquisition | Compare channels on first-order ROAS | Compare channels on customer quality over time |
| Retention | Send the same flows to everyone | Prioritise cohorts with higher likely value |
| Merchandising | Push what converts fastest | Push products and bundles that attract better customers |
| Forecasting | Assume all new customers behave the same | Forecast by cohort, channel, or customer type |
In practice, the strongest teams review CLV anywhere a budget or offer decision gets made. They check whether Meta prospecting is bringing in customers who reorder. They compare affiliate traffic against email-captured first-time buyers. They look at whether a seasonal promotion created future demand or just borrowed revenue from the next month.
Once that discipline is in place, growth gets easier to judge. Weak channels are harder to defend. Retention spend goes to customers worth keeping. Profitability stops being a year-end surprise.
Practical CLV Implementation for Shopify Stores
Theory often breaks down in practice. Merchants understand the formula, but the data is scattered, incomplete, or distorted by platform changes.
On Shopify, customer lifetime value calculation works best when you build it from a small set of dependable inputs first, then add complexity only when the store needs it.
Where to pull the data inside Shopify
Start with the basics you can verify:
- Average order value from Shopify analytics or exported orders
- Order count per customer from customer reports or exports
- First and latest order dates to estimate active customer lifespan
- Product and order mix to see whether repeat behaviour differs by category
- Discount usage and sales channel tags if you want segment-level CLV
If Shopify is the source of truth for orders but not for costs, margin will need to come from your ERP, finance system, or a clean product cost sheet. This is one reason spreadsheet CLV often fails. Teams pull revenue from Shopify, then guess the rest.
Spreadsheet first, app second
A spreadsheet is enough if you're doing one of these:
- building a first baseline,
- validating whether a CLV app is trustworthy,
- or checking a few major cohorts by hand.
Move to a dedicated app or BI setup when you need channel-level cohorts, subscription logic, margin inputs, or near-live dashboards. In practice, Shopify merchants usually look at three categories of tools rather than one perfect app:
- Loyalty and retention platforms that expose repeat behaviour
- Subscription apps that clarify recurring customer economics
- Analytics and BI connectors that combine Shopify with ad, CRM, and cost data
If your store has recurring orders, this gets even more important. A merchant running memberships or replenishment needs CLV logic that reflects recurring billing and churn behaviour, not only one-off order history. Addressing this need, a proper Shopify subscription store setup changes the quality of the data as much as the customer experience.
Handling sparse data after migration or seasonality
This is the underserved problem. Mainstream CLV guides still lean on stable historical averages, but merchants with sparse history, seasonal demand, or recent Shopify 2.0 migrations often need predictive churn modelling or discount-rate adjustments instead, as noted in Salesforce's discussion of customer lifetime value.
That's a common scenario for many Shopify stores. You may have:
- incomplete customer history after migration,
- duplicate customer records,
- limited post-launch reorder data,
- or a sales pattern dominated by gifting or Q4 demand.
When that happens, use a practical fallback:
- Build a short-window historical CLV from clean post-migration data only.
- Compare cohorts by entry month, first product, and acquisition source.
- Flag periods with unusual promotions so they don't define the baseline.
- Use directional ranges for newer cohorts instead of pretending you know the final answer.
Sparse data doesn't mean you should avoid CLV. It means you should stop pretending a single average is precise.
The stores that get this right don't wait for perfect reporting. They start with a defensible baseline, segment quickly, and improve the model as cleaner data accumulates.
If your Shopify store needs cleaner customer data, a migration that preserves reporting integrity, or a custom setup that makes CLV usable in real decisions, Grumspot can help build the store, tracking, and analytics foundation properly.
Let's build something together
If you like what you saw, let's jump on a quick call and discuss your project

Related posts
Check out some similar posts.
- customer segmentation strategy
Build a winning customer segmentation strategy for your e-commerce store. This playbook covers plann...
Read more
- demand forecasting ecommerce
Master demand forecasting ecommerce. Choose statistical & ML models, integrate with Shopify, & reduc...
Read more