How to Calculate Customer Lifetime Value
- customer lifetime value
- CLV formula
- Shopify CRO
- ecommerce analytics
- cohort retention
Launched
July, 2026
You're staring at a dashboard where first-order revenue looks decent, paid social is still bringing in traffic, and finance keeps asking the same awkward question, how much can we spend to win a customer? That's where customer lifetime value stops being a vanity metric and starts doing real work. If you calculate it properly, it tells you what a buyer is worth after refunds, shipping, fulfilment, and support costs, not just what they spent on day one.
For UK ecommerce, that matters more than it used to. The online share of UK retail sales jumped to 37.5% in November 2020 from 19.1% in February 2020 during the pandemic shift to digital shopping, which is exactly why repeat buying and retention now sit at the centre of a useful CLV model, not on the sidelines (Salesforce). In Shopify stores, subscription brands, and DTC businesses, the formula only works when it reflects how customers behave over time.
What Customer Lifetime Value Really Means for Ecommerce
Customer lifetime value is the amount a store can expect to earn from a customer over the full relationship, after you account for how often they buy, how long they stay, and what it costs to serve them. In plain English, CLV is the number that tells you whether a customer is worth acquiring, nurturing, or leaving alone. It's the answer to a question most merchants ask too late, “If I spend this much to get them, do I make it back?”
CLV is not the same thing as average order value. AOV tells you what one transaction looks like, while CLV tells you what the whole relationship looks like. It's also not the same as CAC, which is your customer acquisition cost. CAC is the price of getting the customer in the door, CLV is the value you get once they're inside and buying again.
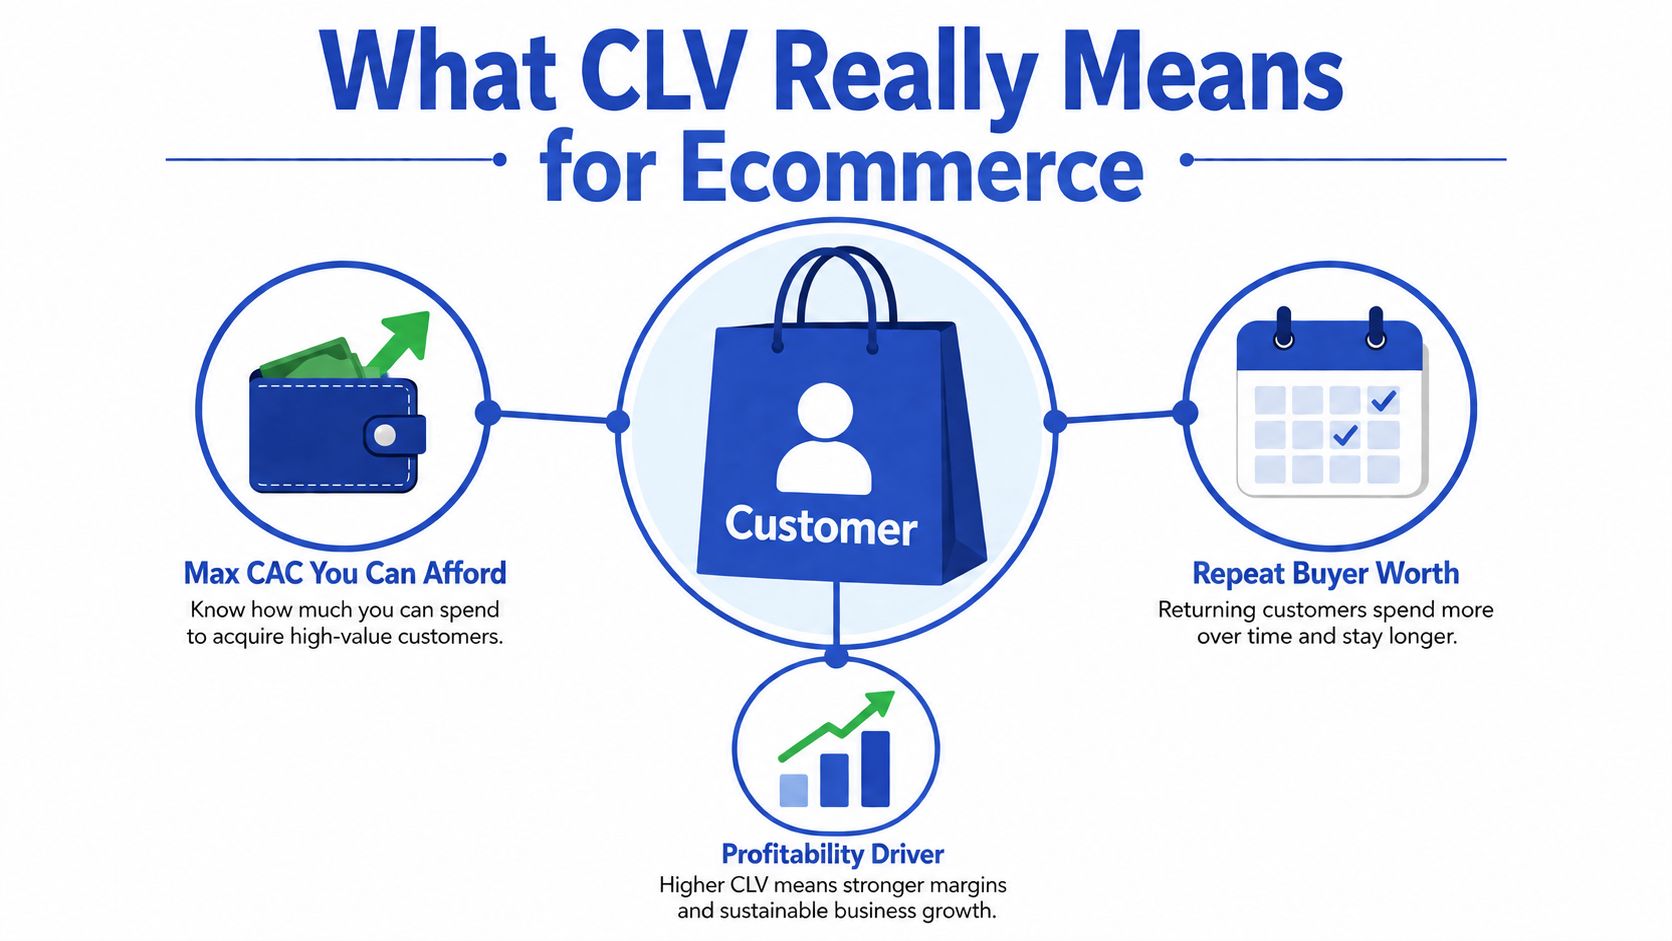
A UK DTC brand selling skincare, for example, can't judge a new customer purely on first basket size if half the business comes from repeat replenishment and subscription bundles. A low-margin acquisition channel might look fine on the front end, then fall apart once shipping, payment fees, and support tickets are counted. That's why CLV matters to finance and growth at the same time, finance uses it to protect margin, growth uses it to decide how hard to bid.
Practical rule: if you can't explain CLV as “what a customer is worth after costs over time”, your model is probably too complicated for the team that has to use it.
If you want a useful example of how customer analysis gets turned into action, it's worth taking a look at explore Cyndra AI solutions, especially if your current reporting is rich in data but weak on decisions. CLV only helps when it changes what you spend, what you keep, and what you stop doing.
The Core CLV Formulas You Can Build in a Spreadsheet
The spreadsheet version of CLV should be boring in the best way. If it needs a data scientist to interpret it, most merchants won't trust it, and marketers won't use it. The safest starting point is the historical formula, then you layer in margin and acquisition cost once the base number behaves sensibly.
Start with the simple historical formula
The classic setup is:
CLV = average order value × purchase frequency × customer lifespan
That gives you gross value over time before serving costs. In spreadsheet terms, put AOV in one cell, purchase frequency in another, and customer lifespan in a third, then multiply across. If your Shopify store has an average order value of £60, customers buy 4 times per year, and they stay active for 2.5 years, the historical CLV is £600.
That number is useful, but it's not yet a profit number. It tells you the scale of the relationship, not whether you can afford the acquisition channel that brought it in. For merchants who bid aggressively on Meta or Google, that distinction matters fast.
Add acquisition cost only after the base model behaves
The next version is the same CLV figure minus acquisition cost. In practical terms, it's a sanity check for whether a customer relationship is worth the spend. If the model says a customer is worth £600 and CAC is £120, the relationship has room. If CAC is close to the CLV figure, the store is basically paying for the privilege of staying busy.
Revenue-only models break here. They make expensive customers look valuable even when fulfilment, discounts, and support eat the margin.
Use the gross-margin-aware version for finance sign-off
The version finance teams will defend is:
CLV = average order value × purchase frequency × customer lifespan × gross margin
For subscription businesses, the practical shortcut is ARPA × gross margin ÷ churn rate. Practitioner finance guidance consistently frames CLV around margin and retention, not top-line revenue alone, because mixing revenue and profit inputs overstates what customers are worth (Wall Street Prep). That's the trap. Revenue looks flattering, margin tells the truth.
| CLV formulas at a glance | Inputs needed | Best for |
|---|---|---|
| Historical CLV | AOV, purchase frequency, lifespan | Quick first pass in Shopify |
| CLV minus CAC | CLV and acquisition cost | Media planning and channel checks |
| Gross-margin CLV | AOV, frequency, lifespan, gross margin | Finance review and budget setting |
A workable spreadsheet setup is simple. Row 2 can hold AOV, row 3 frequency, row 4 lifespan, row 5 gross margin, and row 6 CLV. Once that's in place, you can swap in cohort-level inputs later without rebuilding the whole file.
Cohort and Predictive CLV Models Explained
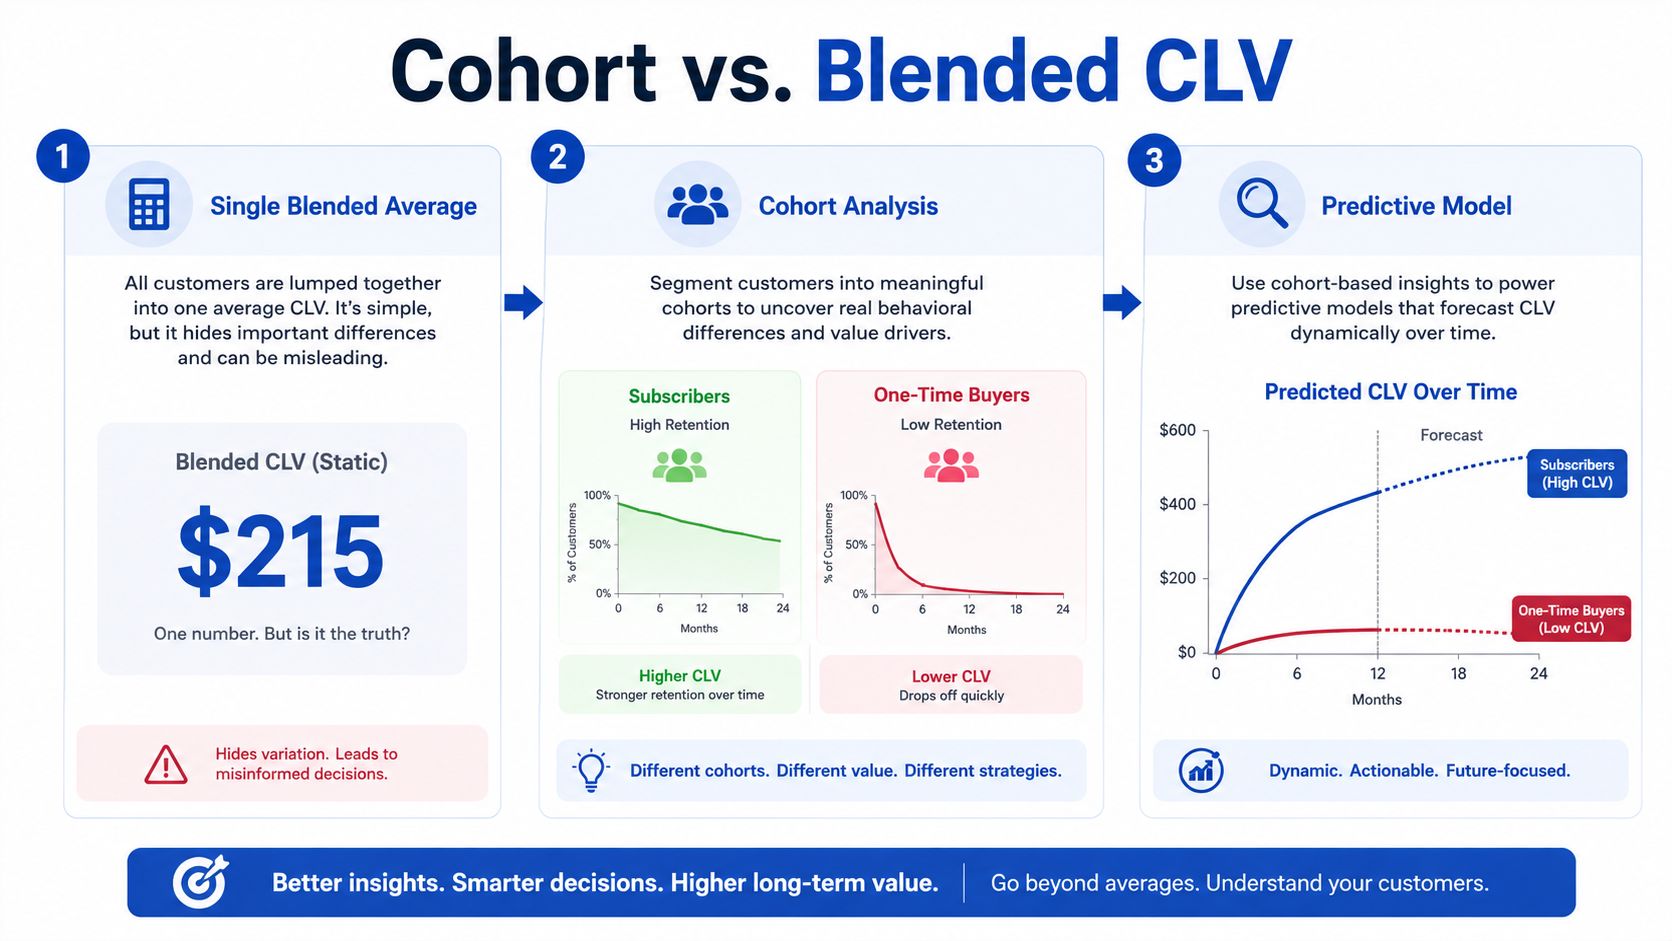
Blended averages are where a lot of CLV work goes wrong. A store with subscription customers, one-time buyers, and mixed acquisition channels does not have one customer behaviour pattern, it has several. If you average them together, the high-retention cohort hides the weak one, and the weak one drags the whole model down.
Use cohorts when retention is not uniform
Cohort-based CLV groups customers by acquisition month, first order type, or subscription status, then tracks retention and revenue inside each group. That approach is more reliable because retention differs materially by channel and by purchase behaviour, and a single lifetime assumption makes CLV too sensitive to early-period churn. The technical guidance on CLV modelling recommends segmenting customers, deriving cohort lifespan or churn, and then aggregating the results after the period-level analysis is done (Customer lifetime value).
In Shopify terms, this is usually the first real upgrade beyond a blended dashboard average. If paid social customers reorder less often than email subscribers, or if first-order bundles behave differently from plain single-item orders, cohorting shows you the difference instead of hiding it.
Predictive CLV is useful, but not always necessary
Predictive models go further. They use historical purchase patterns to forecast future spend and retention, often with frameworks like BG/NBD and Gamma-Gamma in more mature analytics setups. If that sounds like a lot, it is. For stores doing under a few thousand orders a month, predictive CLV is often overkill unless there's a clear reason, like subscription churn, highly variable repeat rates, or serious spend on acquisition.
A useful way to frame it is straightforward. Cohorts answer what happened to customers who started in this period. Predictive CLV answers what will likely happen if current behaviour continues. The second model is more powerful, but only after your first-order data, margin data, and retention logic are clean.
If you want to go deeper on the modelling side, the mechanics pair well with an advanced churn prediction model for subscription cohorts, especially when subscription cohorts start splitting sharply by plan type or acquisition source. For a broader analytical frame, the same logic also fits with predictive analytics concepts for customer value modelling, because CLV becomes more useful once it is tied to behaviour, not just totals.
The right model is the simplest one that still separates your best customers from your worst ones.
Shopify and Subscription Adjustments That Change the Numbers
Most generic CLV formulas fail because they use revenue where they should use gross profit. In Shopify, that's a real mistake, not a theoretical one. Payment fees, shipping, fulfilment, discounts, and support all sit between revenue and actual customer value.
Use gross margin, not raw revenue
For a Shopify store, the number that survives scrutiny is the one built from gross margin after Shopify Payments, shipping, fulfilment, and discount costs. A customer who brings in revenue but burns margin is not a good customer, no matter how nice the dashboard looks. This is why the cash-positive version of CLV needs profit-aware inputs, not top-line sales alone.
A subscription brand makes this especially obvious. If monthly ARPA is strong but churn is high, a revenue-based model can overstate value badly. The cleaner approach is to use monthly ARPA, gross margin, and churn together, then compare that result against the old revenue-only view.
Adjust for subscriptions, bundles, and messy orders
Subscriptions usually behave differently from one-off ecommerce orders, so they need their own inputs. Bundles can inflate AOV, gift cards distort purchase frequency, and wholesale orders can make a DTC store look healthier than it is. If those orders are mixed into the same average, CLV becomes a blended fantasy.
A useful internal rule is to split customer types before calculating. Subscription customers get a churn-based model, one-time buyers get a purchase-frequency model, and wholesale gets separated entirely if it isn't part of normal DTC economics. That keeps the model honest and stops one channel from subsidising another on paper.
The most common spreadsheet error is letting revenue-only logic creep into a gross-margin model. A second error is using one blended retention number across all cohorts, which makes subscription customers look too weak or one-time buyers look too strong. A third is forgetting to deduct the costs attached to discounting, which makes promotional campaigns look better than they are.
For a practical walkthrough of the calculation structure in a Shopify context, the guide at Customer lifetime value calculation aligns closely with the spreadsheet approach merchants use.
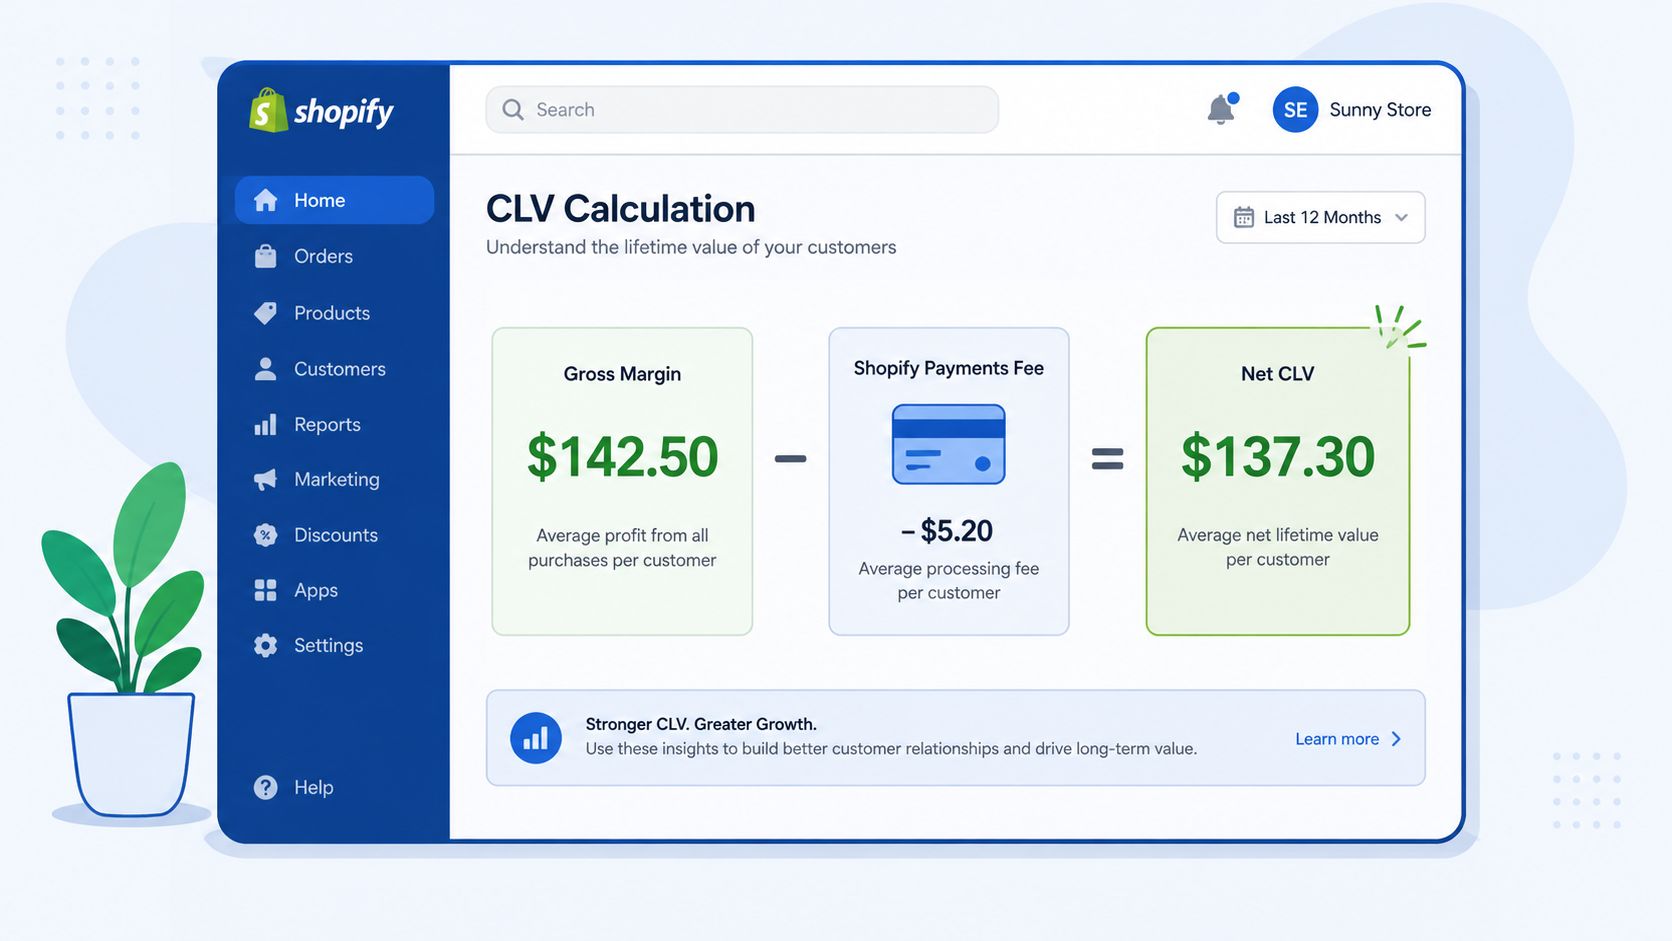
A subscription skincare brand is a good example. If the older model used revenue alone, CLV might look healthy enough to justify aggressive acquisition. Once margin and churn are applied, the number usually drops to something the CFO can live with, and the media buyer has a cleaner ceiling to work from.
Turning CLV Into Marketing and CRO Decisions
A CLV number that never changes a budget is dead weight. The useful version tells you how much to spend, where to spend it, and which customers deserve the next improvement in the funnel. That's the point where analysis becomes operating discipline.
Set a CAC ceiling that respects margin
A practical acquisition rule is to keep CAC comfortably below gross-margin CLV. Many teams use a ceiling around one-third of gross-margin CLV as a working guardrail, then adjust it for channel quality and payback speed. That isn't a law, but it is a far safer planning input than “we think this creative is working”.
Practical rule: if CAC keeps rising while CLV stays flat, the store is buying volume, not value.
Balance retention spend against conversion spend
CLV also tells you whether the next pound should go into retention or into conversion. If repeat buyers carry most of the value, loyalty emails, subscription save flows, and post-purchase education usually deserve more budget than another top-of-funnel test. If first-order conversion is weak but cohort quality is strong, CRO may beat acquisition expansion.
A simple budget shift looks like this:
| Decision lens | AOV-driven choice | CLV-driven choice |
|---|---|---|
| Paid media | Chase the highest first-order basket | Bid more on cohorts with stronger repeat rate |
| Push generic broadcasts | Build retention flows for high-LTV buyers | |
| CRO | Optimise product page revenue only | Test offers that improve repeat behaviour |
The common mistake is optimizing for revenue per click, because that flatters short-term performance and hides poor repeat economics. CLV corrects that bias by asking whether the customer is worth more after the first purchase.
For lifecycle execution, the mechanics fit well with lifecycle email marketing, because post-purchase flows are often where CLV is won or lost. If you prefer a more tactical growth lens, the YouTube discussion below is a useful way to think about turning customer value into practical decisions.
Operationalising CLV in Your Store and Next Steps
CLV only works when the inputs stay clean. Track the events that matter, first order, repeat purchase, subscription renewal, refund, discount use, and cancellation. Pull margin data from Shopify Payments, fulfilment, and discount logs, then match it back to the customer record before you roll the numbers into a cohort view.
Refresh cohorts monthly if you can, because stale retention data turns a useful model into a historical curiosity. Watch for duplicated customers across guest and logged-in orders, missing gross-margin fields, and forgotten discount costs, because those three issues can severely impact accuracy. Wire the finished CLV segments into email, CRM, and paid media so the same customer gets a coherent treatment across channels.
A practical next-step list looks like this:
- Clean the customer table: merge duplicates and make sure guest and logged-in orders point to one profile.
- Lock the margin logic: include payment fees, fulfilment, and discounts before you calculate CLV.
- Split the cohorts: separate subscriptions, wholesale, and one-off DTC buyers.
- Refresh on a schedule: update retention windows monthly and compare new cohorts against older ones.
- Use the output: feed high-value segments into CRM, email, and media bids.
If you want to go further after this, the next models to explore are discounted CLV, blended versus first-order margin, and CLV across multi-product businesses. Those are the places where mature Shopify teams usually go once the basics stop being controversial.
If you want help turning CLV from a spreadsheet into something your team uses, visit Grumspot. They build and fix Shopify stores, CRO systems, and the reporting layers that make customer value visible in day-to-day decisions.
Let's build something together
If you like what you saw, let's jump on a quick call and discuss your project

Related posts
Check out some similar posts.
- black friday campaigns
Compare 7 tools for planning Black Friday campaigns on Shopify, covering email, SMS, personalisation...
Read more
- shopify website examples
Explore 7 Shopify website examples and learn the UX, conversion features, and practical lessons merc...
Read more
- zero party data
Learn what zero party data is, why it matters for ecommerce, and how to collect and use it for perso...
Read more
- cro best practices
Apply cro best practices to Shopify stores with 10 actionable tactics for testing, product pages, ch...
Read more