Mastering Customer Satisfaction Measurement for E-commerce
- customer satisfaction
- ecommerce CRO
- NPS
- CSAT
- customer feedback
Launched
June, 2026

You can feel this problem even when the dashboard looks fine.
Orders are coming in. Revenue is moving. Paid traffic is doing its job. Yet you still don't know what customers think after checkout, after delivery, after a return, or after a support exchange that never shows up in your GA4 reports. Sales data tells you what already happened. It doesn't tell you how fragile those sales are.
That's where customer satisfaction measurement stops being a support metric and becomes a growth system. For ecommerce, it's one of the few ways to connect what customers felt to what they did next. Did they trust the product page? Was checkout annoyingly hard on mobile? Did the return flow save the relationship or finish it off? Those answers shape repeat purchase behaviour, review quality, referral likelihood, and the long-term economics behind customer lifetime value.
Why Happy Customers Are Your Best Growth Hack
A lot of teams still treat satisfaction as a soft signal. It isn't. It's operational intelligence.
If a store only watches revenue, conversion rate, and average order value, it ends up optimising the visible part of the journey while missing what happens just after the sale. That's dangerous because many of the biggest growth leaks sit outside the first conversion. Delayed dispatch updates, confusing returns, poor packaging, awkward subscription management, or a support team that resolves issues slowly can all weaken retention without immediately showing up in top-line sales.
Revenue hides friction
An ecommerce manager can easily misread stable sales as a sign that customers are content. Often, customers are tolerating friction. They'll still buy if the product is strong enough, the price is acceptable, or switching feels inconvenient. But tolerated friction is expensive. It drags on repeat rate, increases complaints, and creates a conversion ceiling because the same UX flaws that frustrate existing customers usually hurt new visitors too.
Customer satisfaction measurement gives you the missing layer between transaction data and customer behaviour.
That's why strong teams don't ask only, “Did they convert?” They ask, “How did that journey feel, and what nearly broke it?”
Satisfaction data is CRO fuel
The best use of customer satisfaction measurement isn't reporting. It's diagnosis.
When you collect feedback at the right moments, patterns emerge fast. Customers mention hidden shipping costs, slow support replies, confusing bundle logic, poor mobile form fields, unclear size guidance, or missing delivery updates. Those aren't abstract insights. They map directly to changes in page layout, copy, navigation, checkout design, policy communication, and retention flows.
A useful way to think about it is this:
- Sales data tells you outcomes: what converted, what dropped, what returned.
- Satisfaction data tells you causes: what felt easy, what felt risky, what felt disappointing.
- CRO turns those causes into experiments: revised flows, stronger reassurance, cleaner UX, better messaging.
Stores grow faster when they stop treating satisfaction as a monthly scorecard and start using it as a prioritisation engine.
Choosing the Right Satisfaction Metrics for Ecommerce
A store sees repeat purchase rate flatten, support tickets rise, and conversion stay stubbornly average. The instinct is often to ask one broad satisfaction question and hope the score points to the answer. It rarely does.
Metric choice decides whether feedback becomes a reporting layer or a prioritisation tool. In ecommerce, that distinction matters because each metric supports a different decision. If the goal is to improve checkout completion, reduce return friction, or fix post-purchase trust gaps, the metric has to match the moment.
What each metric is actually good at
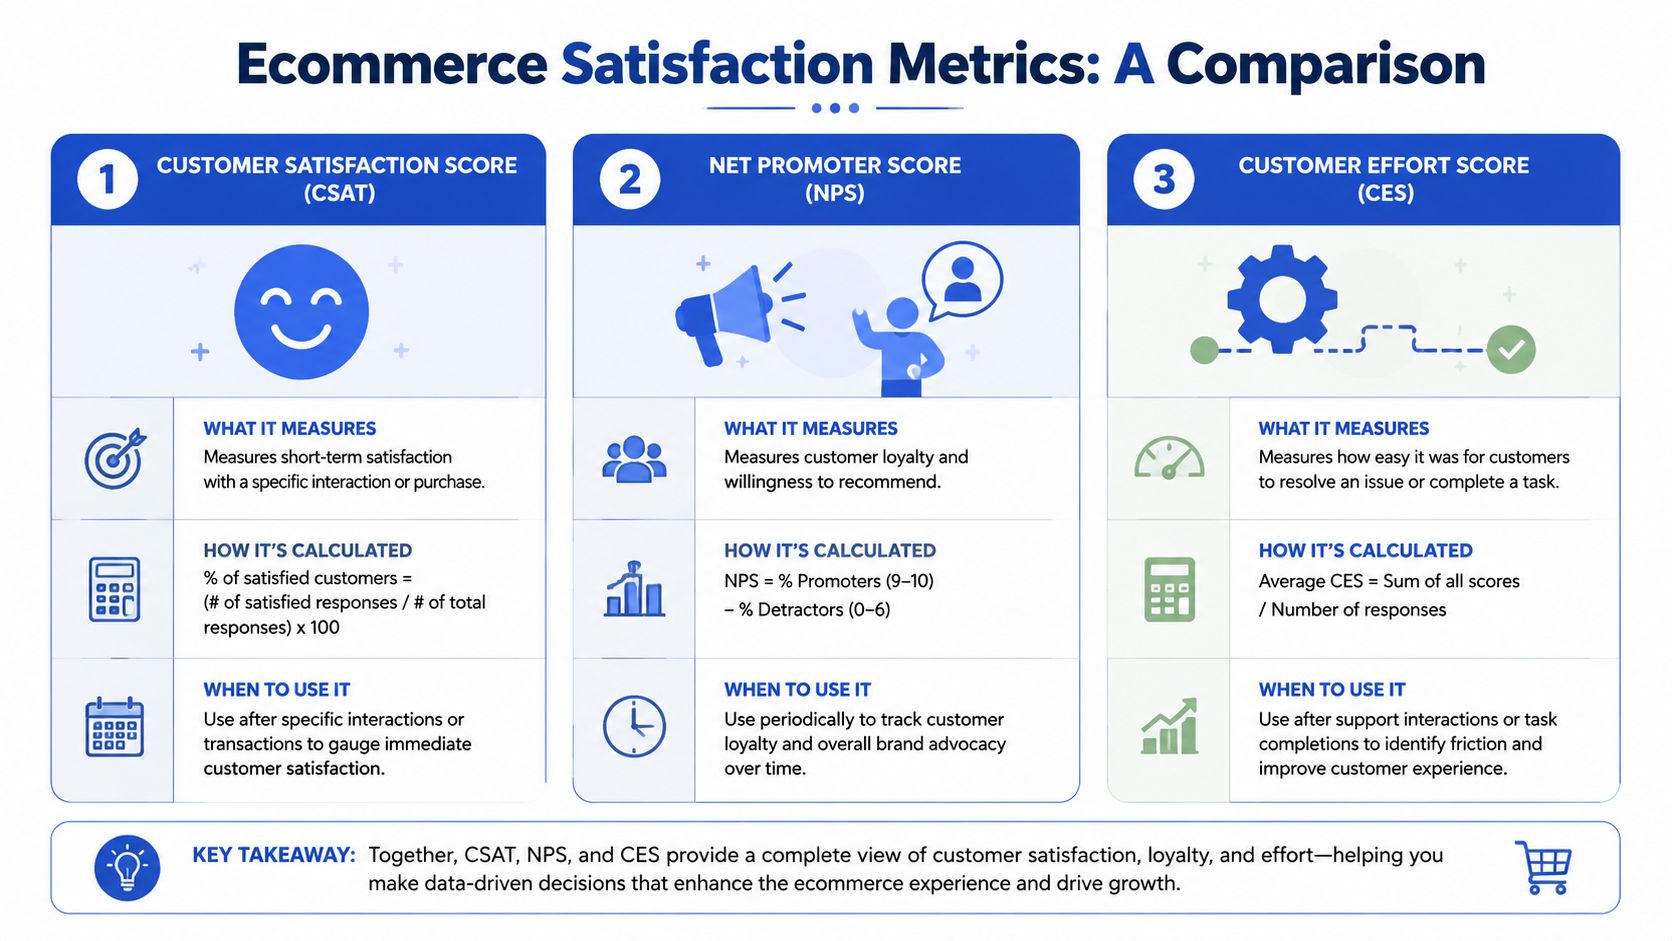
The three metrics ecommerce teams use most are CSAT, NPS, and CES. They are not interchangeable.
CSAT works best for specific interactions. Use it after support conversations, delivery experiences, returns, or post-purchase flows where the team needs a clear read on whether that touchpoint met expectations. The standard calculation is straightforward, either the share of satisfied responses or an average rating, as explained in Nextiva's breakdown of customer satisfaction metrics. Its value is speed and proximity. You can tie the score back to a recent event and identify what needs attention.
NPS measures brand-level sentiment more than operational quality. It asks whether a customer would recommend the brand, so it is better suited to tracking loyalty, retention health, and proposition strength over time. It is less useful for diagnosing why mobile checkout is underperforming or why customers are contacting support after delivery.
CES measures how hard a task felt. That makes it especially useful in ecommerce, where customers often abandon because something felt tedious, confusing, or harder than expected. Applying a discount code, updating a subscription, finding delivery costs, or starting a return should feel easy. If effort is high, conversion and retention usually suffer somewhere in that journey.
A simple way to choose is to map each metric to the part of the journey you want to improve. Teams that already use customer journey mapping for ecommerce UX and CRO decisions usually make better metric choices because they know which touchpoints need diagnosis and which need broader sentiment tracking.
CSAT vs NPS vs CES at a Glance
| Metric | What It Measures | Typical Question | Best For Ecommerce |
|---|---|---|---|
| CSAT | Satisfaction with a specific interaction | How satisfied were you with your purchase/support/return experience? | Post-purchase, post-support, post-delivery, returns |
| NPS | Loyalty and willingness to recommend | How likely are you to recommend us to a friend or colleague? | Brand tracking, retention health, broader relationship sentiment |
| CES | Ease of completing a task | How easy was it to complete this task today? | Checkout, account changes, returns, support resolution |
What works and what usually doesn't
For most ecommerce brands, one metric is not enough. A better setup combines a touchpoint metric with a friction metric, then uses NPS as a periodic pulse rather than the main operating score.
That trade-off matters in practice. A weak CSAT score after a return tells you customers are unhappy. CES helps explain whether the issue came from too many steps, unclear instructions, poor policy communication, or a clunky portal. If support is involved, first-contact resolution adds another layer because unresolved issues often suppress satisfaction even when the agent interaction itself felt positive.
Practical rule: Use CSAT to find dissatisfaction, CES to identify friction, and NPS to track relationship strength over time.
The common mistake is overusing NPS because it feels strategic. I see this often with ecommerce teams that want one headline number for leadership. The problem is actionability. If NPS drops, the team still has to work out whether the cause sits in product expectations, shipping communication, support quality, returns, or checkout UX. That is why store operators who care about weekly improvements usually put CSAT and CES closer to the workflow.
If you're weighing that choice, this article on solving the NPS CSAT dilemma is a useful read because it frames the decision around what the team needs to act on.
A practical metric stack for stores
A sensible stack depends on complexity, order volume, and how many customer touchpoints the brand controls. For most stores, this is enough:
- Use CSAT after clear events: support resolution, completed returns, delivery issue resolution, or onboarding for subscriptions.
- Use CES on high-friction tasks: checkout, account access, subscription changes, warranty claims, and returns initiation.
- Use NPS periodically: quarterly or at another consistent interval, as a relationship signal rather than a daily operating metric.
- Track first-contact resolution with service feedback: satisfaction without resolution can hide expensive support problems.
This mix gives teams something more useful than a dashboard score. It gives them a way to connect customer sentiment to specific fixes, then turn those fixes into CRO tests, UX updates, and service improvements that affect revenue.
Designing an Effective Customer Feedback Programme
Bad survey design creates bad decisions.
I've seen stores ask long, fuzzy questionnaires days after the interaction, then wonder why the feedback is inconsistent. Customers don't remember details clearly, response quality drops, and the team ends up debating the data instead of acting on it. A strong programme is short, well-timed, and tied to moments that matter.
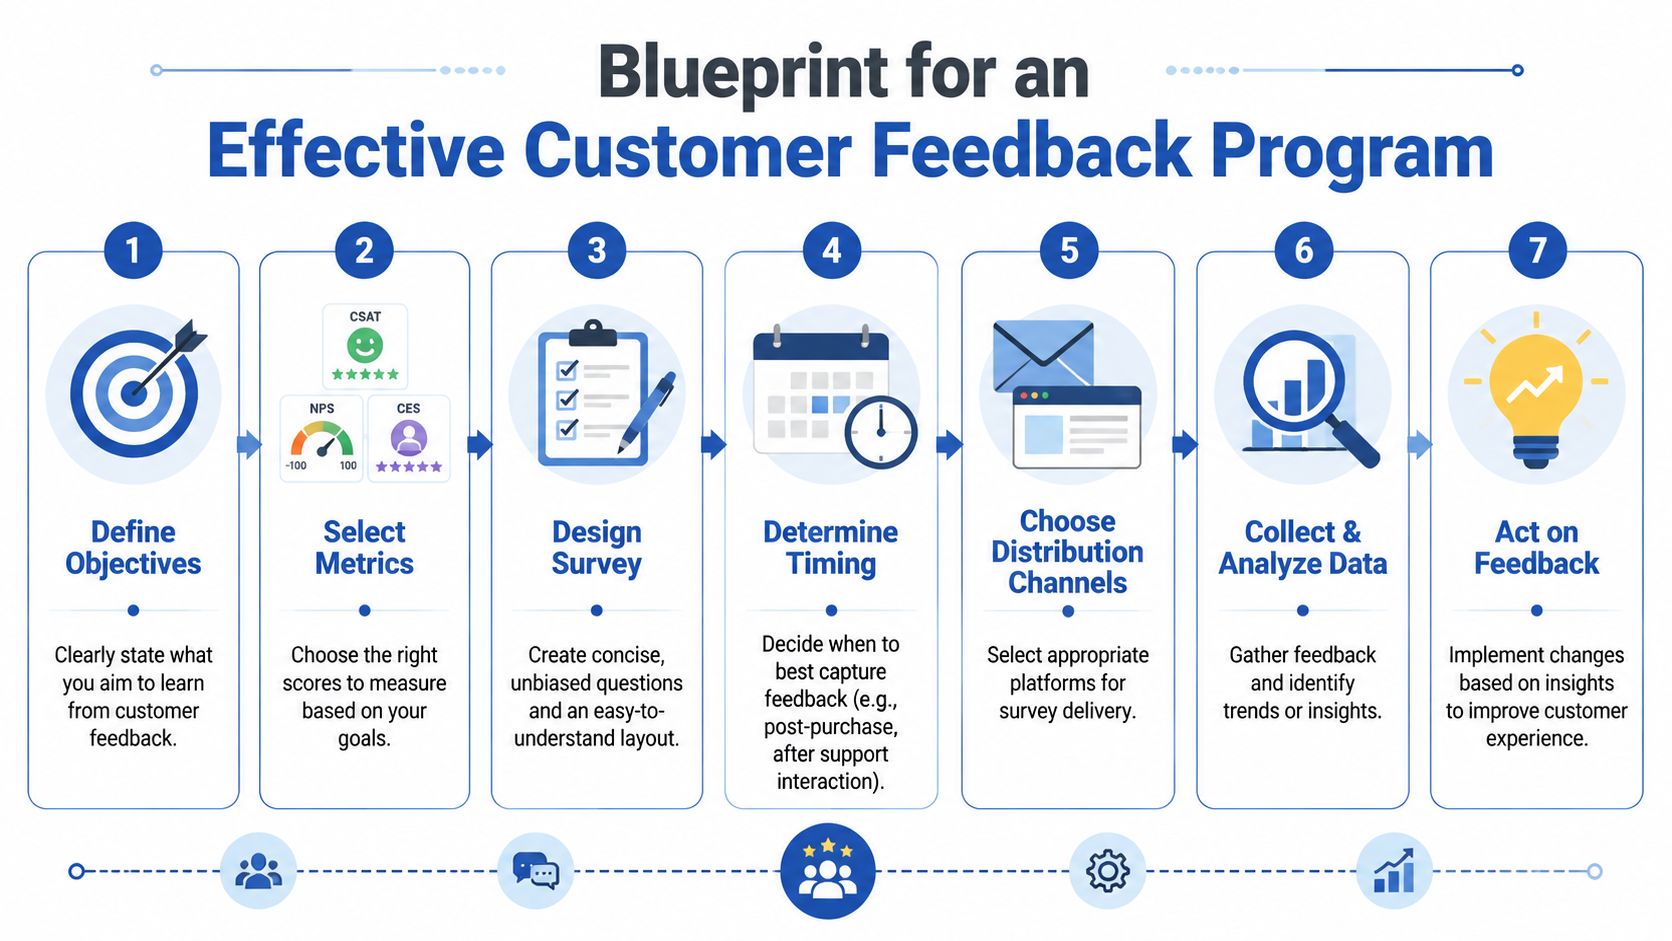
Keep the survey short and event-based
The most actionable pattern is channel-synchronous and short-cycle. The strongest approach is to send a brief 1 to 3 question survey immediately after purchase, return, or support resolution, because transactional feedback is least distorted by recall bias and stays closely tied to the touchpoint being measured, as noted in IntelliShop's guide to measuring customer satisfaction.
That timing matters more than teams think. Ask too late and customers answer from memory. Ask too early and you miss the result of the experience. For ecommerce, good triggers usually include:
- Post-purchase: useful for checkout clarity, confidence, and perceived ease
- Post-delivery: useful for packaging, delivery communication, and product expectation match
- Post-support resolution: useful for service quality and whether the issue ended
- Post-return completion: useful for friction in reverse logistics and refund confidence
Write questions that produce usable answers
A lot of survey fatigue comes from poor wording, not from surveys themselves.
Use one clear rating question, then one open-text follow-up. That's usually enough. If someone gives a low score, the comment explains why. If they give a high score, the comment often reveals what to preserve and amplify.
A practical structure looks like this:
- Primary metric question: aligned to the touchpoint, such as satisfaction or effort
- Open-text follow-up: “What was the main reason for your score?”
- Optional operational field: channel, device, order type, or issue category pulled in automatically
For scale choice, consistency matters more than theory. If your team can't interpret the difference between two similar response options, the extra granularity won't help. Keep the wording stable so month-to-month comparisons remain clean.
Short surveys win because they respect the moment. Customers are more willing to answer when the ask feels proportionate to the interaction.
Don't rely on surveys alone
Survey scores are useful, but the programme gets better when you combine them with broader research methods. Session recordings, heatmaps, support transcripts, review mining, and interview-based discovery all add context that surveys miss. If your team needs a broader view of how qualitative research fits around measurement, this overview of UX research methods is a solid companion resource.
This is also where customer journey mapping helps. Once you map the stages from product discovery through delivery, exchange, and repeat purchase, it becomes obvious where feedback should be collected and which metric belongs to each stage.
Avoid the programme-killing mistakes
Three habits usually ruin feedback quality:
- Over-surveying everyone: repeated asks train customers to ignore you
- Mixing goals in one survey: don't combine loyalty, delivery, support, and product fit in one form
- Failing to route responses: if operations, UX, and support all need different signals, send feedback to the right owner automatically
A feedback programme works when it feels less like research theatre and more like instrumentation for the customer journey.
Analysing Feedback to Uncover Hidden Opportunities
A score tells you there's a fever. It doesn't tell you what caused it.
That's why average satisfaction scores often create false comfort. Teams celebrate a decent overall result while a specific customer group is getting steadily more frustrated. In ecommerce, that usually means your most profitable segment is experiencing friction that gets diluted in the aggregate.
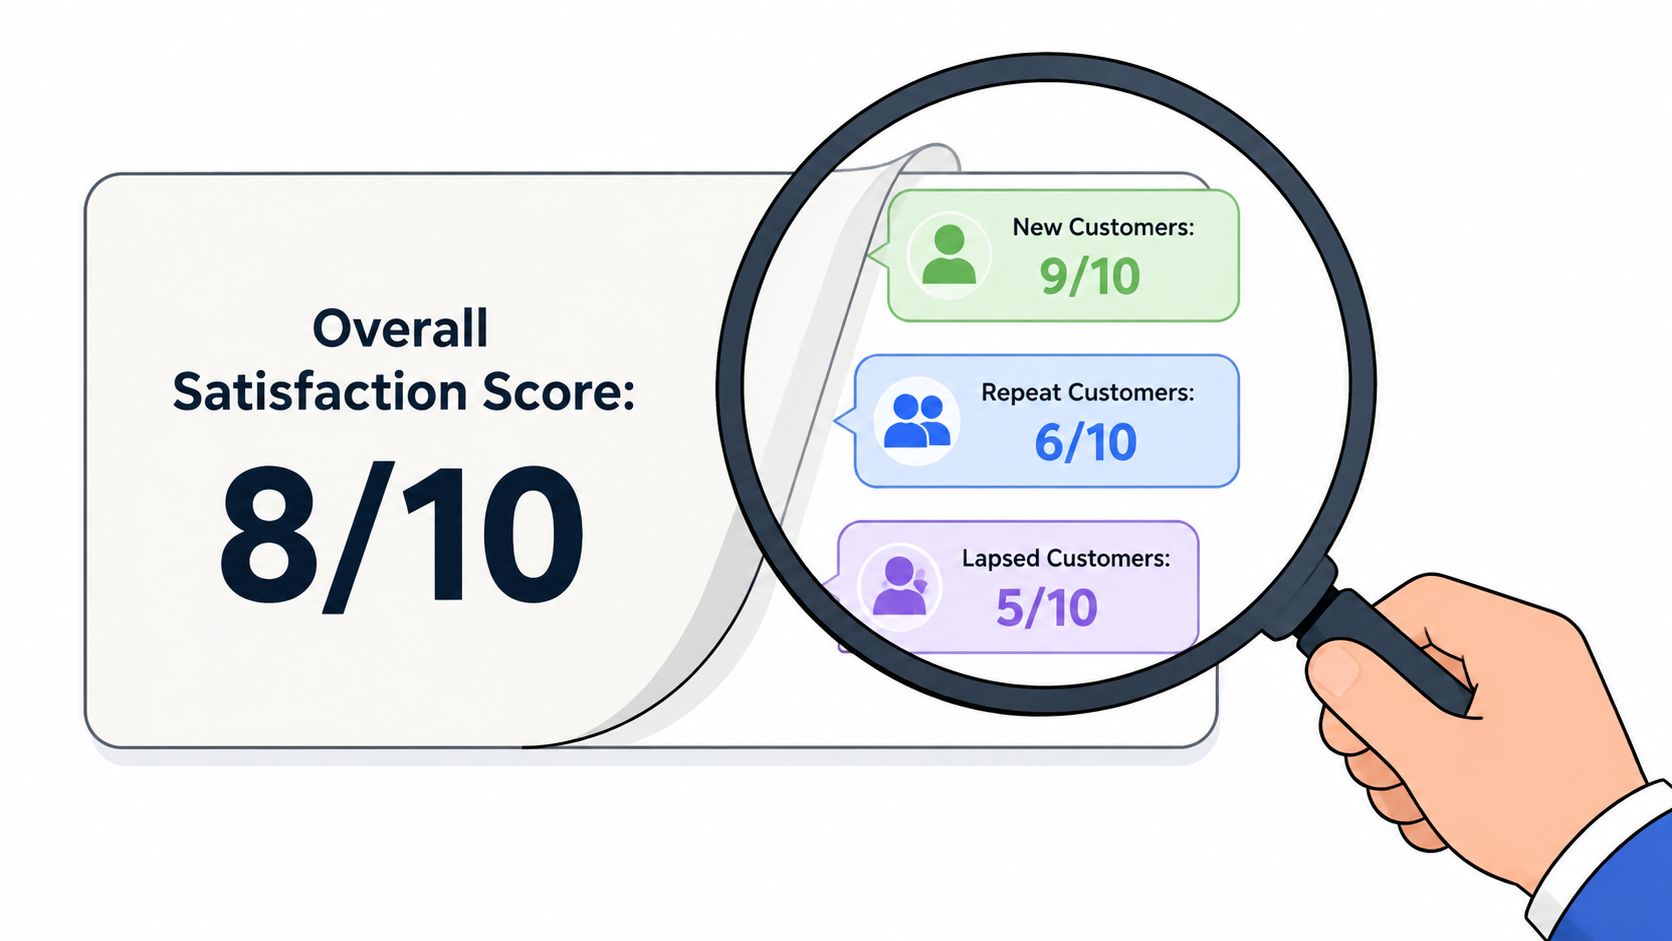
Segment before you conclude anything
A key principle in customer satisfaction measurement is breaking results down by group. Better practice is to analyse by plan tier, acquisition channel, product area, and new versus returning customers, because a good overall score can hide severe dissatisfaction in a profitable subgroup, as highlighted in Formbricks' discussion of customer satisfaction measurement.
For ecommerce, the most revealing segments are often:
- New vs returning customers: new shoppers expose clarity issues, returning shoppers expose operational consistency
- High-value vs low-value cohorts: premium customers often have lower tolerance for friction
- Mobile vs desktop users: mobile usually surfaces avoidable effort first
- Acquisition source: paid social customers may arrive with different expectations than branded search visitors
- Product category: apparel, subscription, bulky goods, and replenishment products often generate very different feedback themes
If your team wants to decide whether a change is real or just noise, it also helps to pair segment analysis with statistical significance testing, especially when you're comparing satisfaction shifts after a UX update or checkout experiment.
Turn comments into themes
Open-text responses are where significant value lies. The mistake is leaving them as a pile of anecdotes.
Tag comments into a small set of operational themes. Keep the taxonomy practical. Most stores don't need a complex voice-of-customer ontology. They need a clean list that reflects real decision areas.
A simple tagging structure might include:
| Theme | What it usually points to |
|---|---|
| Shipping clarity | PDP messaging, checkout disclosure, dispatch comms |
| Product expectation | imagery, copy, sizing, merchandising |
| Checkout friction | form design, payment options, mobile UX |
| Support quality | routing, resolution, tone, delays |
| Returns difficulty | policy wording, portal UX, refund updates |
Once comments are tagged, the qualitative layer becomes quantifiable. You can see whether dissatisfaction is clustering around shipping communication, size confidence, or support delays rather than trying to infer everything from a single score.
The average score tells you how hot the problem is. The comments tell you where to cut.
Look for patterns across signals
Strong analysis combines structured and unstructured data.
If low CES appears on mobile checkout, and session recordings show repeated field errors, and support tickets mention payment confusion, that's not three separate insights. That's one fix with three forms of evidence.
This is the point where customer satisfaction measurement becomes commercially useful. You stop asking whether customers are happy in general, and start asking which journey stage is creating avoidable friction for which segment.
Setting Benchmarks and Meaningful Targets
A team sees CSAT rise from 78 to 81 and calls it a win. Two weeks later, conversion is flat, support contacts are up, and return complaints have shifted from delivery delays to confusing sizing. The score moved. The customer experience did not improve in a way that changed commercial performance.
That is why benchmarks and targets need more discipline than a single headline number.
Start with a baseline you can actually use
The most useful benchmark for an ecommerce team is usually internal. Use the same metric, at the same touchpoint, with the same survey wording over time. That gives you a stable baseline you can trust when a product page rewrite, checkout change, carrier issue, or policy update affects customer sentiment.
I would break that baseline down by journey stage and by segment early. Sitewide averages hide too much. First-time buyers, repeat customers, mobile shoppers, high-AOV orders, and support-assisted purchases often behave very differently. If satisfaction drops for one of those groups, the right response is rarely a storewide fix.
That level of benchmarking helps teams answer practical questions fast. Did the new payment mix reduce checkout effort on mobile? Did a stricter returns policy hurt post-purchase satisfaction for apparel shoppers? Did support satisfaction improve after changing SLAs for delivery issues?
Use external benchmarks for calibration, not prioritisation
External benchmarks are still useful. They help leadership teams judge whether a score is broadly healthy or clearly underperforming.
For UK businesses, the right source is the UK Customer Satisfaction Index from The Institute of Customer Service. It provides a consistent reference point across sectors and is far more reliable than comparing your store against informal averages quoted in secondary summaries.
But external benchmarks only set context. They do not tell an ecommerce manager what to fix this quarter. A national benchmark will not explain why paid social traffic reports lower satisfaction after purchase, or why customers buying from a specific category struggle with product expectations.
Use outside benchmarks to frame the conversation. Use internal benchmarks to set the work.
Set targets at the level where decisions get made
Company-wide targets are fine for reporting. They are weak tools for improvement.
Useful targets sit closer to the experience you can change:
- Mobile checkout effort: reduce friction during payment completion
- Post-delivery satisfaction: improve satisfaction for late-delivery contacts
- Returns experience: increase successful self-service return starts
- Product expectation: reduce dissatisfaction tied to sizing or item accuracy
- Repeat customer sentiment: recover satisfaction in high-value returning segments
Those targets create clearer ownership. CRO, UX, merchandising, operations, and support can each see what they influence and what success should look like.
One caution matters here. Targets should reward better customer experience, not better survey management. If teams start changing survey timing, filtering respondents, or pushing for small score gains without any corresponding shift in conversion, repeat rate, refund rate, or support demand, the target is being gamed rather than met.
A benchmark gives the score meaning. A target should tell the team what to change, where to change it, and how to judge whether the change worked.
Turning Satisfaction Data into CRO and UX Wins
This is the part most guides skip.
Collecting feedback is easy. Turning it into better conversion paths, stronger retention, and fewer support-driven leaks is the actual challenge. Customer satisfaction measurement earns its keep only when it changes what the store does next.
Early in the process, it helps to visualise the handoff from insight to execution.
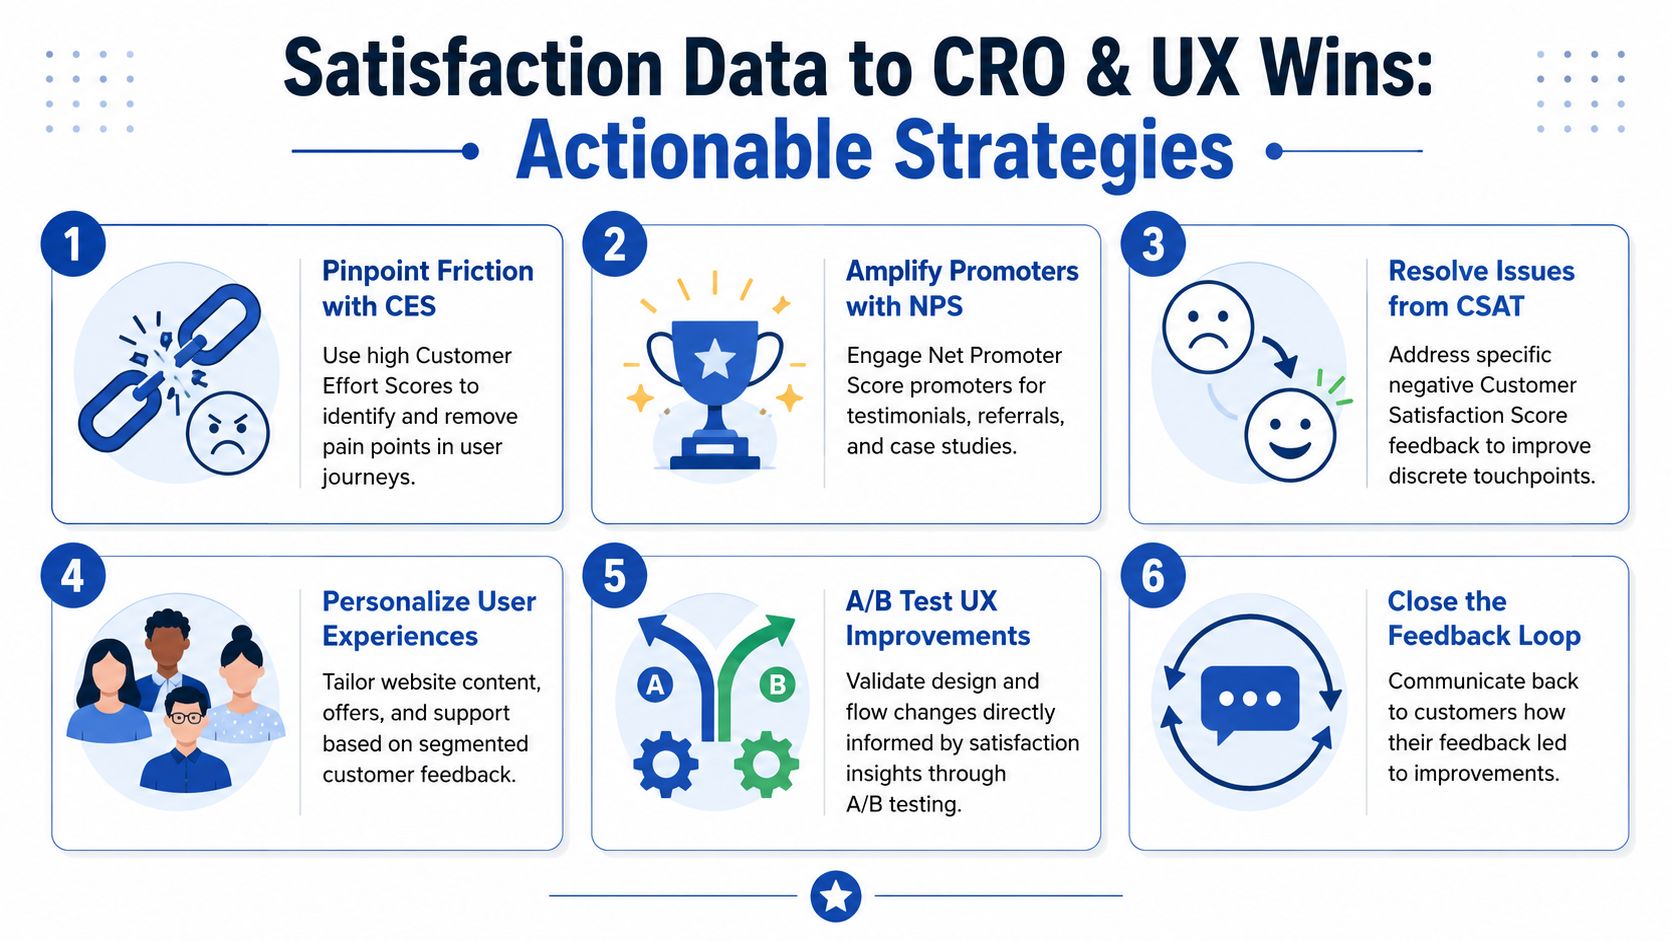
Translate patterns into testable changes
A missed angle in customer satisfaction measurement is that survey scores alone can conceal the underlying problem. The more useful question is which stage of the journey is causing dissatisfaction for which segment, and what operational metric explains it, as discussed in Front's guide to measuring customer satisfaction.
That framing changes how CRO teams work. Instead of treating feedback as commentary, they treat it as prioritised evidence.
Here's what that looks like in practice:
Pattern: customers mention surprise shipping costs in open-text responses
CRO action: test clearer delivery messaging on PDPs, cart, and mini-cart. Consider a postcode-based shipping estimator or simpler threshold messaging.Pattern: CES is poor on mobile checkout
UX action: reduce field count, enable wallet payments, simplify error handling, and review keyboard/input behaviour on mobile devices.Pattern: support CSAT drops for order-tracking tickets
Operational action: improve proactive dispatch and delay notifications so customers don't need to ask in the first place.Pattern: new customers report uncertainty about fit or compatibility
Merchandising action: strengthen size guides, comparison tables, FAQs, and post-click reassurance near add-to-cart.Pattern: return-related comments focus on policy confusion
Content and UX action: rewrite policy language in plain English and surface return expectations before purchase, not only in the footer.
Pair voice-of-customer with behavioural tools
The strongest wins happen when feedback and behaviour point at the same issue.
If customers say checkout feels fiddly, validate that with session recordings, funnel steps, and form analytics. If customers complain about delivery expectations, compare those comments against page content, order status messaging, and support contact reasons. When multiple signals line up, prioritisation gets much easier.
A practical stack might include survey tools inside Klaviyo or Shopify email flows, review mining, support platform exports, Hotjar for recordings and on-page feedback, and experimentation tools for testing fixes. Some teams also bring in ecommerce specialists such as Grumspot when the work requires Shopify UX changes, theme-level development, or CRO execution across storefront and checkout.
Here's a useful walkthrough if you want a broader perspective on experience optimisation in action:
Close the loop with a prioritisation model
Not every complaint deserves a redesign.
Use a simple decision filter:
| Signal | Ask this question | Likely next move |
|---|---|---|
| High volume | Is this theme recurring across many responses? | Prioritise for immediate investigation |
| High value segment | Is the issue affecting repeat or premium customers? | Escalate even if volume is moderate |
| Journey criticality | Does it sit near conversion, payment, delivery, or returns? | Treat as revenue-relevant |
| Fixability | Can the team test or ship a change quickly? | Move into CRO sprint or UX backlog |
The important shift is mental. Satisfaction data isn't a report card for support. It's a roadmap for reducing friction in the places that matter commercially.
Building Your Customer Satisfaction Dashboard
A good dashboard should help a trading or ecommerce lead spot problems fast. It doesn't need to be fancy.
The simplest useful version fits on one screen and gets reviewed weekly. It should show your primary touchpoint metrics, short-term trend movement, segment breakdowns, and the top comment themes behind the scores. If the dashboard only shows averages, it will hide the very issues you need to act on.
What to include
At minimum, track:
- Primary score by touchpoint: checkout, support, delivery, returns
- Trend view: a rolling view so one noisy week doesn't distort interpretation
- Segment splits: new vs returning, mobile vs desktop, key product groups
- Top qualitative themes: the most common tagged reasons for low and high scores
- Operational companion metrics: complaints, response times, resolution times, or other journey signals relevant to the touchpoint
A dashboard works best when ownership is explicit. Support should own service issues. Ecommerce should own storefront and checkout friction. Operations should own fulfilment communication and return logistics. Shared visibility matters, but accountability matters more.
Three quick wins for this week
If you want to start fast, do these three things:
- Add one post-purchase or post-support survey: keep it short and include one open-text question.
- Tag the last batch of feedback manually: even a small sample will reveal repeated themes.
- Pick one friction point and test a fix: don't wait for a perfect programme before acting.
Customer satisfaction measurement becomes valuable the moment it changes a decision.
If your store has the feedback but not the implementation bandwidth, Grumspot can help turn satisfaction insights into practical Shopify UX, CRO, and development changes. That might mean tightening checkout flows, improving product-page clarity, rebuilding return journeys, or connecting customer feedback to a faster experimentation roadmap.
Let's build something together
If you like what you saw, let's jump on a quick call and discuss your project

Related posts
Check out some similar posts.

- Shopify AOV optimization
Boost your revenue with our Shopify AOV optimization guide. Discover actionable tactics, Plus-specif...
Read more
- Shopify CRO audit
Unlock higher conversions with our complete Shopify CRO audit framework. A step-by-step guide for da...
Read more
- conversion rate optimization for ecommerce
Unlock higher revenue with our guide to conversion rate optimization for ecommerce. Learn to audit, ...
Read more
- conversion-focused web design
conversion-focused web design that converts visitors into customers. Learn proven tips to optimize y...
Read more