Net Promoter Score Explained: The 2026 Guide
- net promoter score
- NPS guide
- NPS ecommerce
- NPS benchmarks
- NPS survey
Launched
July, 2026
You're staring at a dashboard that says sales are fine, support tickets are normal, and checkout conversion hasn't fallen off a cliff. Then a customer abandons checkout, never complains, and tells three friends your brand is risky. That gap between visible problems and silent frustration is exactly where Net Promoter Score, or NPS earns its keep.
What Net Promoter Score Measures
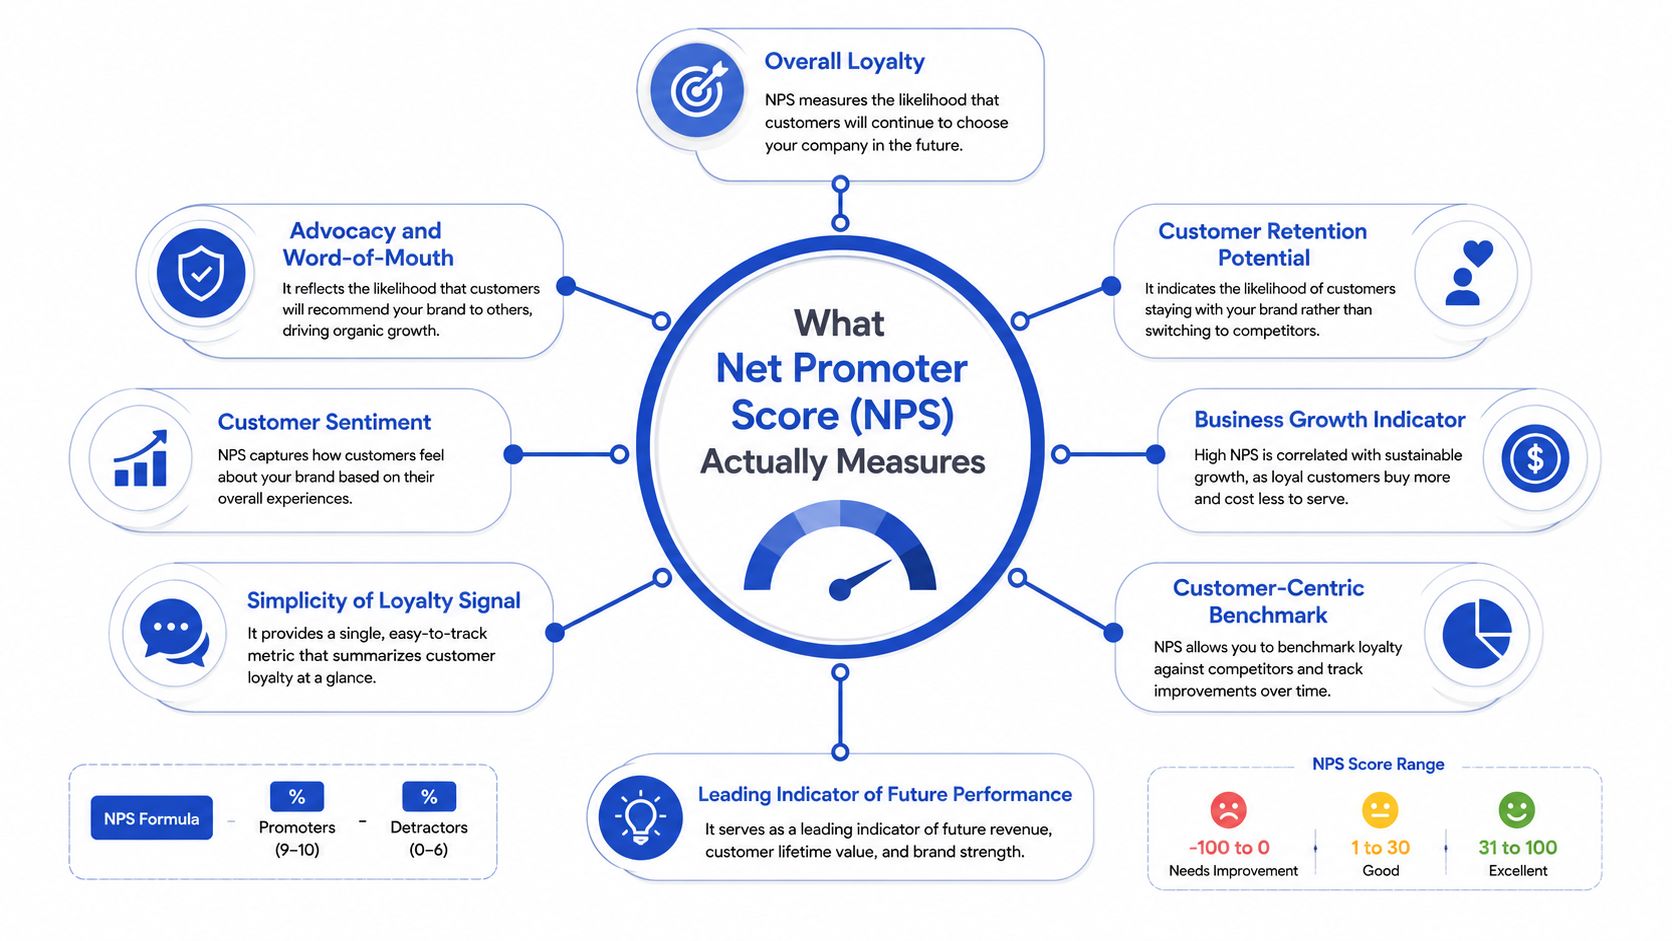
Net Promoter Score explained properly starts with what it is not. It is a loyalty metric built around one question, how likely someone is to recommend your business, product, or service. That framing is widely used in customer experience research and survey design, including summaries from customer experience measurement resources, because the score is meant to capture recommendation intent in a single number.
That matters in ecommerce because recommendation is public. A shopper can be mildly pleased and still never advocate for you, or they can be frustrated enough to stop buying without ever filing a complaint. NPS is useful because it catches that hidden layer of behaviour, the part that doesn't always show up in support queues or post-purchase surveys.
Why recommendation intent matters
A customer who'd recommend you is giving you more than a compliment. They're putting some of their own credibility behind your brand, which is why the question has stayed useful for so long. UK-facing guidance also treats NPS as a loyalty metric first, then a diagnosis tool second, which is why it's usually paired with a follow-up question about the reason behind the rating (DataKind UK NPS guide).
Practical rule: If you only remember one thing, remember this. NPS measures propensity to advocate, not general happiness.
That distinction helps junior teams avoid a common mistake, reading a lukewarm score as a total failure. A business can have decent satisfaction and still struggle to create advocates, especially if delivery, returns, or support create enough friction that customers won't recommend it. For a broader look at how brands measure customer sentiment, compare NPS with customer satisfaction measurement.
A useful way to judge the score is to separate the three response groups in your head. Promoters signal active advocacy, detractors point to risk, and passives sit in the middle as the quiet majority that often gets ignored because they are neither enthusiastic nor openly unhappy. That middle group matters because it can keep a score flat even when the brand is not collapsing, which makes NPS more useful as an early warning signal than as a vanity number.
The important habit is to treat NPS as a signal, not a sentence. It tells you where loyalty is leaning, then the follow-up question tells you why. Used that way, it becomes an early clue that something in the ecommerce experience is nudging customers away from advocacy before the problem shows up elsewhere. A team reviewing deliverability, for example, might pair it with the MailGenius email deliverability tool to check whether post-purchase messages are reaching inboxes cleanly before trust slips further.
The NPS Calculation Step by Step
The formula looks simple because it is simple. The hard part is remembering that NPS is a distribution, not a raw average, so the buckets matter more than the headline.
Start with one 0 to 10 question
Ask the standard question, how likely are you to recommend us to a friend or colleague on a 0–10 scale. Then sort the responses into three groups, 9–10 are promoters, 7–8 are passives, and 0–6 are detractors (ScienceDirect overview of NPS). The final score is % promoters minus % detractors, which is why the result can run from -100 to +100 rather than behaving like a traditional percentage.
That subtraction is the part people miss. Passives count in the denominator because they are part of the full response set, but they never enter the numerator, so they drag the score toward zero without ever being the headline problem.
Work it by hand once
Use the UK example from a widely used guide. If 70% of respondents are promoters, 20% are passives, and 10% are detractors, the NPS is 60, because 70 minus 10 equals 60 (DataKind UK NPS guide). That's the cleanest way to explain the maths to someone new, because it shows that passives don't add positive momentum, they sit in the middle and dilute the impact of advocacy.
Useful shortcut: Promoters lift the score, detractors pull it down, and passives compress the gap.
If you want to sanity-check the score before you launch a survey, a deliverability check helps too, because broken inbox placement can skew who responds. A practical tool like the MailGenius email deliverability tool can help you spot whether your survey invites are even reaching people before you trust the results.
Once you've calculated a few sample scores by hand, the logic becomes automatic. You stop seeing NPS as a mysterious brand health number and start reading it as a simple balance sheet of advocacy versus friction.
Why NPS Works Best as a Distribution
Glance at the score and stop there, and you'll lose the best insight, because the value sits in the shape of the response distribution, not just the final number.
The middle matters more than people think
A large passive cohort suppresses the score toward zero even when detractor volume looks manageable. That's because passives sit in the denominator but never support the numerator, so a business can feel “not bad” on the surface while still struggling to create genuine advocates. The score only moves meaningfully when customers shift from the middle into promoter territory, or when friction pushes them down into detractor territory (Qualtrics NPS overview).
For ecommerce teams, that's the first reason to stop treating NPS like a vanity widget. If a checkout flow, delivery promise, or support reply creates more passives, the score may drift flat even though the underlying experience has become more brittle. Flat isn't always healthy. Sometimes it just means the middle is getting wider.
Read the shape, not just the average
A single number hides the story. The distribution tells you whether you have a loyalty problem, a friction problem, or a “good enough” problem where customers are satisfied but not enthusiastic. In practice, the distribution helps you separate two very different situations, a store with mild dissatisfaction but strong advocacy, and a store with almost no detractors but too many people sitting on the fence.
That distinction matters when you're prioritising CRO work. If the passive group is large, small changes to product presentation, trust signals, delivery messaging, or post-purchase reassurance can shift more people into promoter territory than you'd get from fixing one isolated complaint. That's why I tell junior marketers to look at the bucket mix first, then read the score second.
If you only report the final score, you miss the early warning signs. The buckets are the warning signs.
In ecommerce, the earliest signal often appears in detractors after checkout, fulfilment, or support interactions, which is why the distribution deserves the first look. A score alone can be tidy. The distribution is what tells you whether your customer base is getting healthier.
Designing an NPS Survey That Returns Real Insight
Survey design decides whether you get a useful signal or a noisy one. The same score can mean very different things depending on when you ask, who you ask, and whether your follow-up question invites a real answer.
Ask at a meaningful moment
Transactional NPS works best when the experience is still fresh, such as after purchase, delivery, or support resolution. Relational NPS serves a different purpose, it tracks the health of the broader relationship over time, rather than one interaction. If you ask at the wrong moment, you don't get cleaner insight, you get emotional weather.
The biggest design mistake is sampling only happy buyers. If you trigger the survey too early, too selectively, or only after a positive event, you'll overstate advocacy and miss the friction that most needs fixing. That's where a segmentation strategy helps, because customer types, order types, and lifecycle stage all shape the answer you receive. For a deeper practical lens, the customer segmentation strategy guide is a useful companion when you're deciding which cohorts deserve separate treatment.
Keep the follow-up open-ended
The score matters, but the reason matters more. One short open-text question, such as asking why someone gave that rating, gives your team the context the number can't provide. Without that question, NPS becomes a scoreboard with no instructions.
The best responses are specific. “Delivery was late” is more actionable than “Not great.” “The returns policy was unclear on mobile” tells a CRO lead exactly where to look. “Customer service fixed it fast” tells you what to repeat.
Make the survey easy to finish
Mobile-friendly formatting matters because a lot of people answer on their phone, and a clumsy layout turns a short survey into friction. Keep the request brief, make the response buttons obvious, and avoid turning the NPS invite into a long brand essay. The more effort it takes, the more you bias the sample toward your most motivated customers.
Use the same survey logic at consistent moments so you can compare like with like. That's how you turn NPS from a one-off campaign into a stable feedback channel that shows whether customer sentiment is moving.
UK Ecommerce Benchmarks and Statistical Considerations
A benchmark can be helpful, but only when you treat it as a reference point, not a verdict. In ecommerce, the same NPS can sit on top of very different customer experiences, so the number alone can hide more than it reveals.
Read your score as a trend line
For UK ecommerce teams, the more useful habit is to track your own score over time and compare it within the right segments. Generic benchmark tables can give a rough sense of direction, but they do not tell you whether checkout friction is easing, whether delivery expectations are being met, or whether one category is pulling sentiment down. As noted in the DataKind UK NPS guide, the score becomes easier to interpret when you place it in context rather than reading it as a standalone grade.
Use the score like a trend line on a dashboard. One uplift can be noise. A repeated rise or fall in the same cohort is much more informative, especially when you are trying to spot an early warning before a wider issue shows up in revenue or repeat purchase behaviour.
Segment before you judge
Two ecommerce stores can show the same NPS and still be in very different places. One may have a healthy promoter base but recurring complaints around delivery, while the other may have a large passive middle that is holding back advocacy. That is why cohort cuts matter, by channel, product line, new versus repeat customers, or support interaction type.
A useful way to read NPS is to treat it like a crowd at a checkout queue. A few loud promoters can make the score look fine, but a crowded middle tells you many customers are still undecided, which is often where future movement begins.
If you want the result to hold up, avoid over-reading a tiny sample or a single sharp swing. The statistical significance testing guide is worth revisiting when a small movement looks dramatic but may still fall within normal random variation.
Use comparisons carefully
NPS was never built to make every brand directly comparable. B2B and B2C customers judge different journeys, and ecommerce businesses with different fulfilment models, product complexity, or repeat-purchase cycles often produce very different response patterns. The better question is whether the score fits the customer mix you serve, and whether it is moving in the direction you want.
Practical rule: If the segment view and the headline score disagree, trust the segment view first.
There is a good reason for that rule. A top-line score can stay steady while one cohort starts slipping, and that kind of drift usually shows up before the broader store performance changes. A senior CRO team should treat that as a signal to investigate rather than a number to celebrate.
A product experience can also shape how customers answer the question in ways that a raw score will not show. If you are reviewing advocacy after delivery, returns, or packaging touchpoints, the retail packaging solutions guide is a useful reminder that the physical unboxing moment can affect how customers remember the brand.
Common Pitfalls That Distort Your NPS
NPS breaks down fastest when teams use it for convenience instead of truth. The metric itself is sturdy, but the way people collect and interpret it is where the damage starts.
The easiest ways to distort the signal
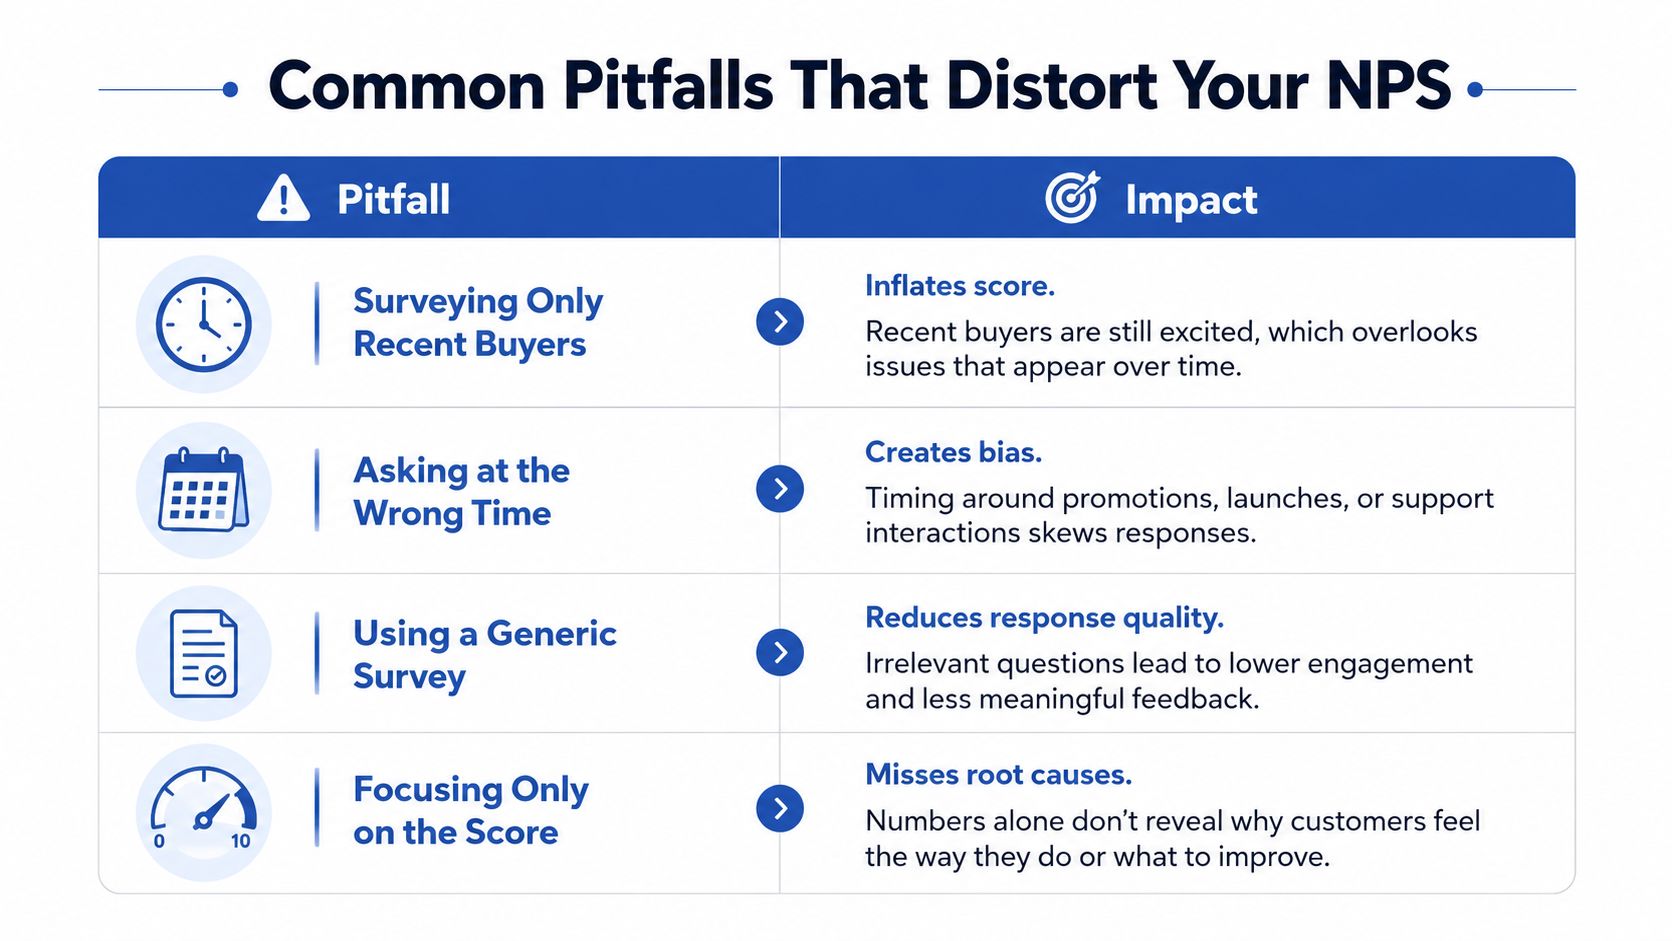
- Surveying only recent buyers: This inflates the score because it overweights fresh optimism and misses delayed disappointment after delivery, usage, or returns.
- Asking at the wrong time: A survey launched during a bad moment can capture frustration that has more to do with timing than with the full experience.
- Using a generic survey: A one-size-fits-all request reduces response quality because it doesn't reflect the touchpoint or the customer type.
- Focusing only on the score: This hides the causes, which means the team celebrates or panics without knowing what to fix.
A lot of teams also misuse NPS internally. They rank staff on it, push for a single quarterly target, or treat it like a customer satisfaction measure when it's really about advocacy. That erodes trust fast, because people start gaming the number instead of improving the experience.
Why passive customers are not “fine”
Passives are the easiest group to ignore and the most dangerous group to ignore. They're not angry enough to dominate your dashboard, but they're also not excited enough to become advocates. In ecommerce, that often means the buying experience is functional but forgettable, which is a problem when competitors are one tab away.
This is also where product presentation and packaging expectations can shape sentiment. If you're thinking about the experience customers receive at the doorstep, the retail packaging solutions guide is a useful reminder that post-purchase perception doesn't end at checkout.
Don't compare unlike with unlike
A discount-driven store can generate promoters who love the deal but won't recommend the brand at full price. A premium store can collect fewer obvious detractors but more cautious passives. If you compare those businesses on the headline score alone, you'll miss the commercial reality behind the number.
The cleanest fix is disciplined sampling, a consistent question, and honest segmentation. When teams do that, NPS becomes hard to game and easier to trust. When they don't, it turns into a monthly argument dressed up as a metric.
How to Move the Score With Ecommerce Actions
NPS only matters if the business does something with it. A score that sits in a dashboard and never changes customer behaviour is just expensive decoration.
Start with detractors, then work outward
Detractors need a fast, human response. A personal reply within 48 hours, routed to the team that owns the friction point, is the right kind of operational discipline because the problem is rarely “the brand” in the abstract. It's usually checkout confusion, late fulfilment, broken expectations, or a support reply that felt careless.
That recovery work should be concrete. Fix the issue, explain the fix plainly, and make sure the customer feels heard. In a Shopify Plus context, I've seen checkout friction show up in NPS before revenue visibly weakened, which is exactly why a detractor workflow is a CRO tool, not just a CX courtesy.
Convert passives into confident buyers
Passives are where ecommerce teams often leave value on the table. These customers aren't unhappy, but they're not convinced enough to advocate, which means the opportunity is in removing uncertainty. Better unboxing, stronger post-purchase education, clearer delivery updates, and more useful product guidance all help turn “fine” into “worth recommending.”
This is also where proactive communication pays off. If a customer knows what happens next, what to expect from delivery, and how to use the product well, the experience feels calmer. Calm experiences create more promoters than noisy ones.
Activate promoters without wasting them
Promoters are your most visible growth lever, but only if you ask them to do something useful. Reviews, referrals, testimonials, and short case studies all turn positive sentiment into acquisition fuel. If you never invite those customers to participate, you're leaving advocacy unstructured and underused.
The best promoter programmes don't ask for praise first. They ask for proof, then make that proof easy to share.
The CRO lens matters here because the point isn't sentiment for its own sake. It's reducing friction, reinforcing trust, and turning strong experiences into assets the next buyer can see. That's how NPS stops being a score and starts becoming an operating system for customer growth.
Your 30-Day NPS Action Plan
Start by auditing the survey itself. One owner in CX or marketing should check placement, timing, device experience, and whether the survey is reaching the right cohorts. The first deliverable is a clean map of where the current signal may be biased.
Next, rewrite the follow-up question so it invites a specific answer, not a polite shrug. Assign support or CRO to review the responses and tag the most common friction themes. Then build a detractor-response workflow with named owners, because a score without follow-up is just data.
Finally, set a baseline segment view, new versus repeat customers, channel, and product line. Track the distribution, not just the headline score, and review it on a fixed cadence.
Grumspot helps ecommerce teams turn customer feedback into conversion-focused change, from Shopify Plus builds to rigorous CRO and SEO audits that expose the friction behind the numbers. If your NPS is pointing at checkout, delivery, or support issues, visit Grumspot and see how a sharper storefront and faster execution can turn that signal into action.
Let's build something together
If you like what you saw, let's jump on a quick call and discuss your project

Related posts
Check out some similar posts.