Average Conversion Rate: How to Calculate and Read It
- average conversion rate
- conversion rate benchmark
- ecommerce conversion rate
- UK ecommerce
- conversion rate calculation
Top-quartile UK ecommerce stores reportedly convert 3.5–5.5% of sessions, compared with 0.8–1.5% for bottom-quartile stores, according to Storebuilt's UK ecommerce benchmark summary. That spread makes an average conversion rate a useful reference, but a poor instruction for what to fix.
For a Shopify merchant, the commercially useful question isn't whether the whole store beats an average. It's which visitors aren't buying, where they stop, and how much revenue an improvement could recover. Answering that requires a consistent formula, segment-level reporting and a revenue measure beside the headline percentage.
The Formula and a Worked Example
A conversion rate is orders divided by sessions, multiplied by 100. For ecommerce analysis, define the conversion as a completed purchase, rather than mixing purchases with newsletter subscriptions or other actions.
Take a hypothetical store with 10,000 sessions, 230 orders and £14,000 revenue during a month. These are illustrative inputs, not market benchmarks.
Calculate each metric separately:
Conversion rate = 230 ÷ 10,000 × 100 = 2.3%
Average order value = £14,000 ÷ 230 = £60.87
Revenue per session = £14,000 ÷ 10,000 = £1.40
Core ecommerce metrics with a worked example
| Metric | Formula |
|---|---|
| Conversion rate | Orders ÷ sessions × 100. Example: 230 ÷ 10,000 × 100 = 2.3% |
| Average order value | Revenue ÷ orders. Example: £14,000 ÷ 230 = £60.87 |
| Revenue per session | Revenue ÷ sessions. Example: £14,000 ÷ 10,000 = £1.40 |
In a spreadsheet, put sessions, orders and revenue in separate input cells. Divide orders by sessions and format the result as a percentage. Don't multiply by 100 as well if the spreadsheet's percentage formatting already performs that display conversion.
A session is a visit, not a person. Someone who browses on a phone and returns later on a laptop can contribute separate sessions, while generating only a single order.
The word average usually refers to a blended rate across the reporting period. Calculate it from total orders divided by total sessions, not by taking an unweighted average of daily percentages. Otherwise, a quiet day's result receives the same influence as a busy day's.
Reconcile before optimising
Use Shopify Analytics or your configured analytics platform to export sessions and completed orders for the same period. Match the reporting timezone, sales channel and order-status rules before comparing your calculation with the dashboard.
Also check what the platform labels as conversion. Orders per session and sessions containing a purchase aren't necessarily identical if a visit generates multiple orders.
Practical rule: A conversion rate is only as trustworthy as its numerator, denominator and tracking definitions.
Recalculate last month's result from the underlying totals. If it doesn't reconcile, investigate missing purchase events, duplicated transaction identifiers and mismatched reporting scopes before changing the storefront. There's little value in optimising against a measurement error.
Common Misreadings That Skew Your Rate
A rate can be mathematically correct and still support the wrong conclusion. Most mistakes happen when merchants compare figures with different populations or change the counting rules.
Claims to challenge before reporting
- “Sessions tell us how many shoppers arrived.” They count visits, not unique people. Check whether your report uses sessions, users or active users before naming the denominator.
- “All recorded traffic belongs in the calculation.” Staff testing and automated traffic can distort the result. Review your platform's bot exclusions and internal-traffic controls, and document when filters change.
- “Checkout conversion is our store conversion rate.” Checkout entrants are a selected group already close to purchasing. Confirm the starting population before putting rates beside each other.
- “A stronger promotional month proves the redesign worked.” Offers, delivery deadlines and seasonal buying intent can change the result. Compare equivalent trading conditions rather than assuming the website caused the movement.
- “A higher rate means visitors found the store easier to use.” A shift towards returning customers can change the blend without changing anyone's experience. Check customer mix alongside the result.
- “A competing store gives us a fair target.” Category, price point and brand familiarity affect purchase decisions. Compare the business model and audience before adopting its benchmark.
- “Every purchase event represents another valid order.” Retries or faulty event implementations can duplicate transactions. Reconcile unique order identifiers, and treat refunds separately under a consistent revenue policy.
A reporting checklist
Before quoting any average conversion rate, record:
- Population: Sessions, users or checkout entrants.
- Scope: Dates, timezone, country and sales channels.
- Counting rules: Completed orders, purchase events or purchasing sessions.
- Context: Promotions, stock availability and tracking changes.
Keep that definition beside the dashboard. It prevents a persuasive-looking percentage from becoming a misleading performance claim.
UK Benchmarks and What a Normal Rate Looks Like
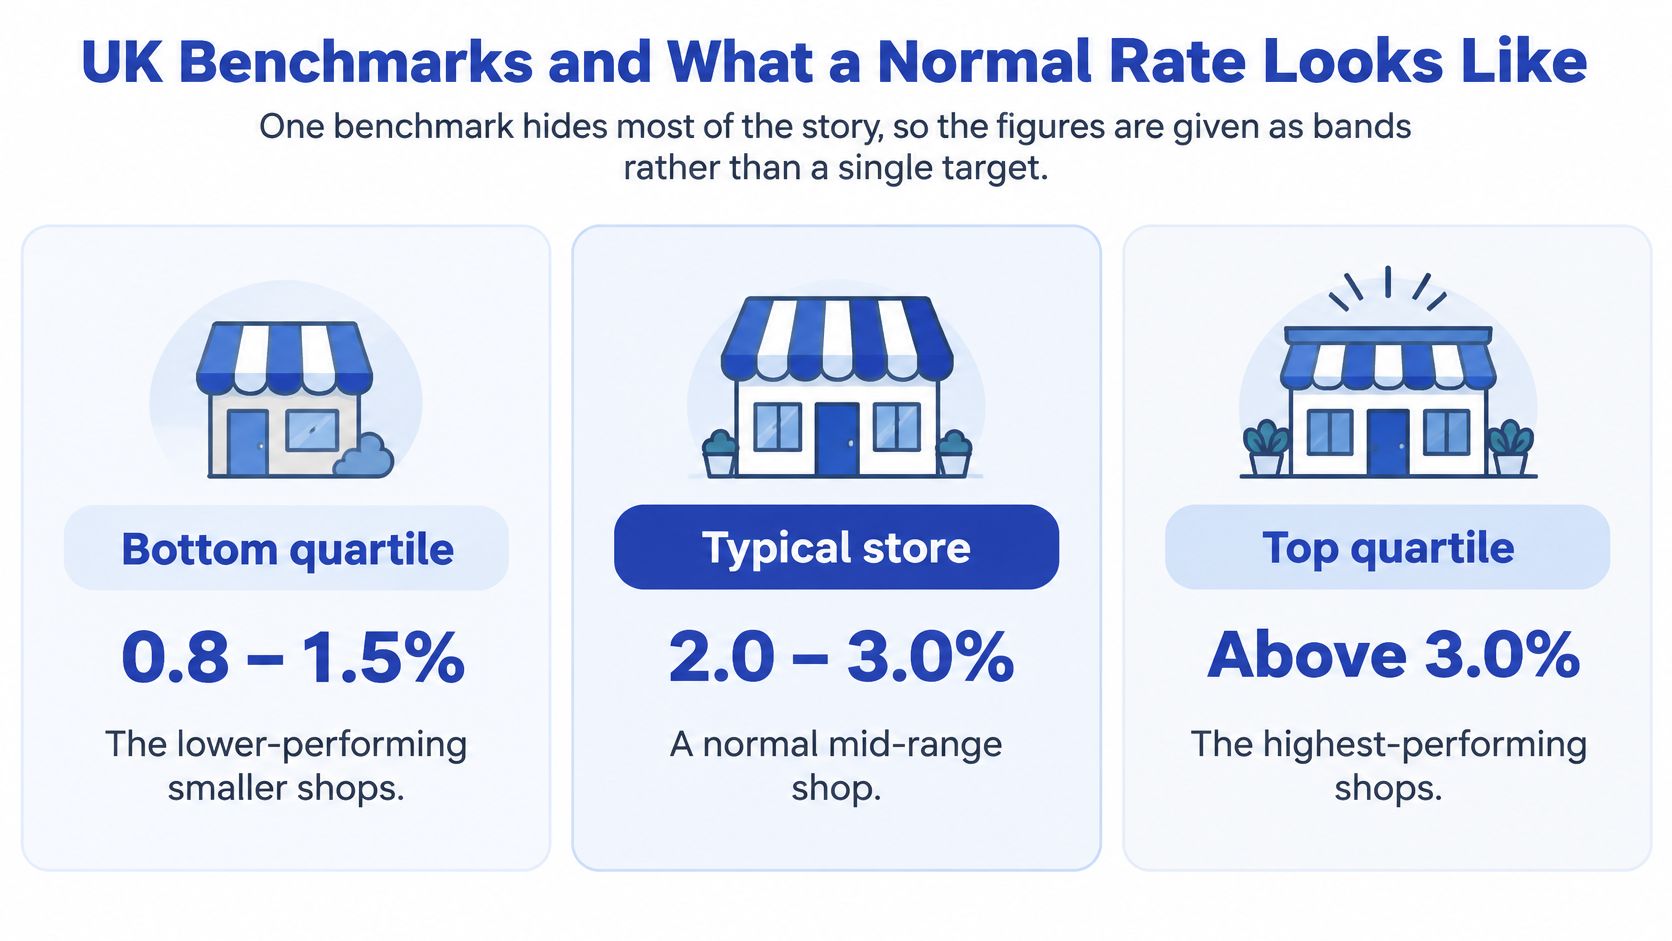
Use benchmark bands to frame an investigation, not to prescribe a target. The Storebuilt summary cited in the opening describes a distribution, but it doesn't establish a matched peer group for your particular store.
UK ecommerce conversion bands by quartile
| Band | UK conversion range | What it usually signals |
|---|---|---|
| Bottom quartile | 0.8–1.5% | A reason to investigate traffic mismatch or friction on core pages |
| Typical store | 2.0–3.0% | A broad UK ecommerce planning band |
| Top quartile | 3.5–5.5% | Potentially strong purchase intent, brand familiarity or repeat buyers |
These are reported planning ranges, not proof of the causes in the final column. A low rate doesn't establish that your checkout is broken, just as a high rate doesn't establish that your acquisition strategy is profitable.
The visual summarises the broad bands. For numerical comparisons, use the table rather than treating the graphic's simplified top-band label as a quartile boundary.
For a dated regional reference, Statistics Global's UK ecommerce statistics reports an average session conversion rate of 1.97% for UK and Irish online retailers in September 2026, compared with 1.68% in September 2025.
That's a rise of 0.29 percentage points, calculated by subtracting the earlier rate from the later rate. Don't describe it as a percentage increase without doing the separate relative-change calculation.
The scope matters. This covers UK and Irish retailers, not every UK merchant, sector, device mix or acquisition channel. A brand selling mainly to familiar customers and a store introducing itself through cold social advertising aren't interchangeable comparisons.
Read the band as a diagnostic prompt
- Below the typical band: Identify the segment responsible before concluding that the entire store underperforms. Check whether its traffic has a realistic opportunity to buy.
- Above the typical band: Inspect loyalty, branded demand and promotional activity. Establish whether stronger conversion reflects better execution or a different audience.
- Inside the band: Compare against your own recent history. An apparently normal rate can still conceal a deterioration in an important segment.
Don't calculate an average of these published ranges and the monthly regional figure. They describe different populations and reporting approaches, so combining them wouldn't create a more reliable benchmark.
A market reference tells you where to investigate. Your own comparable segment history tells you whether performance has changed.
The next questions are operational: which segment is pulling performance down, and is revenue per session moving in the same direction? Neither answer is visible in a national average alone.
Why One Average Hides the Real Problem
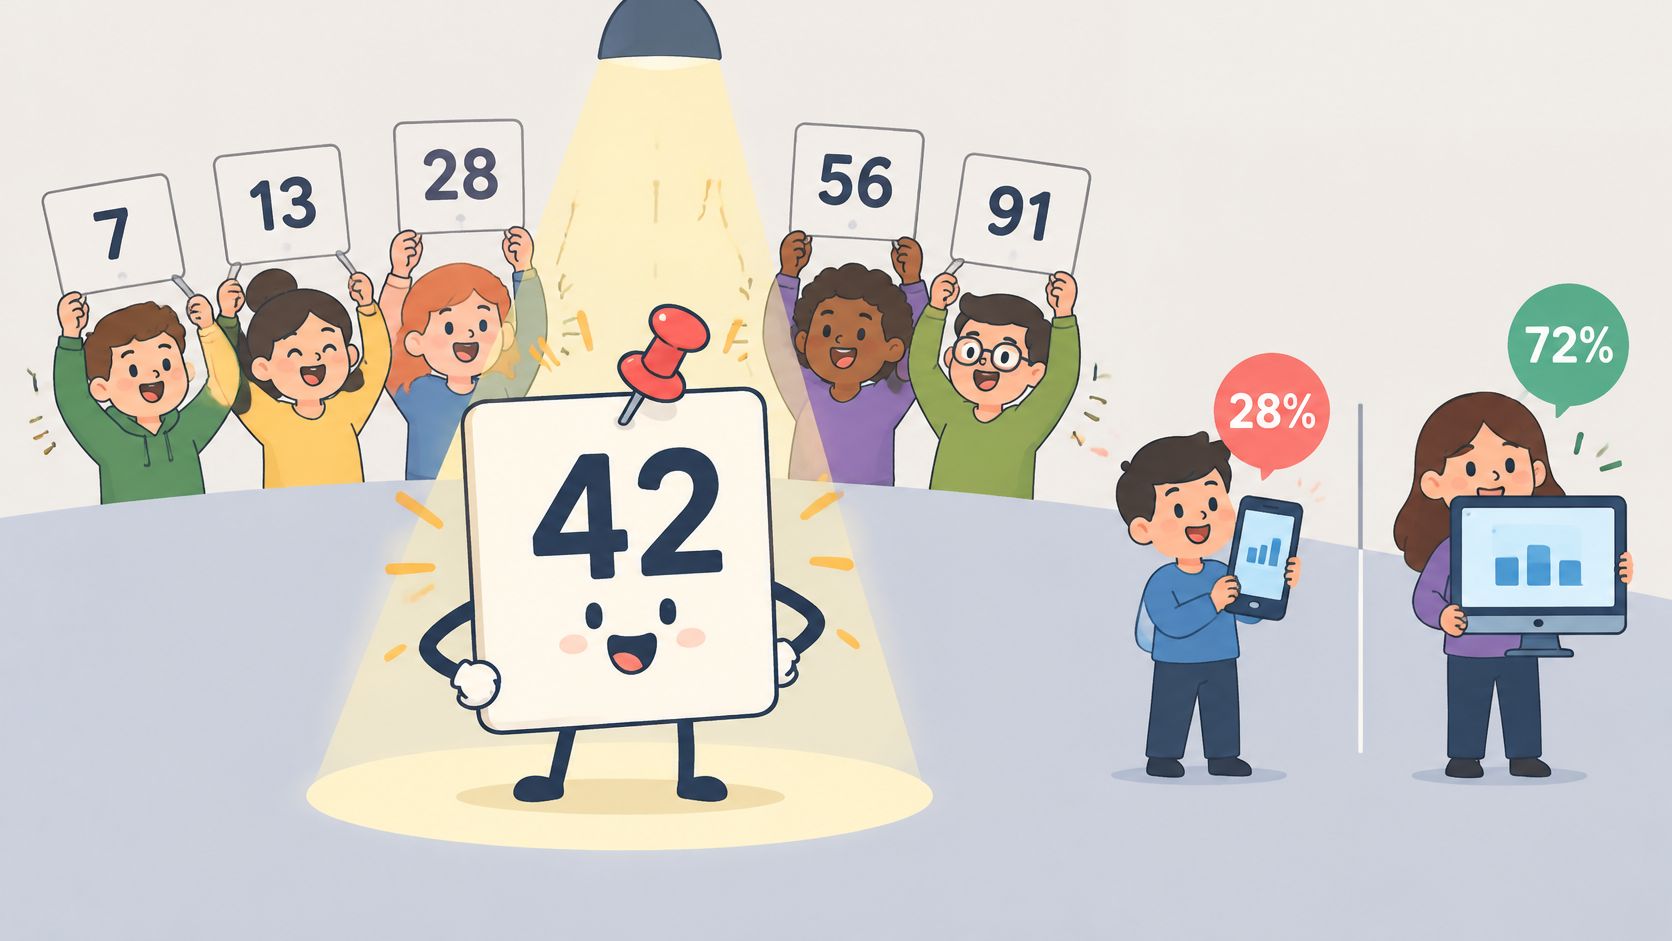
A blended rate weights each segment by its share of sessions. Traffic mix changes can move the headline even when the experience in every segment has stayed flat. If a lower-converting segment grows from a small share to a large one, the blended rate falls without any page getting worse. The same store can look better because a high-converting campaign brought in more returning buyers.
The illustration makes the point visually: a prominent number can stand for a bundle of different segments.
The benchmark figures associated with Statista's Great Britain conversion-rate series record 1.67% in Q1 2026, versus 1.75% a year earlier. The change describes the market, not the cause. It cannot tell you whether your own checkout, product pages or traffic sources changed.
Conversion rates by segment and reference period
| Segment | Conversion rate | Reference period |
|---|---|---|
| Great Britain ecommerce visits | 1.67% | Q1 2026 |
| Great Britain ecommerce visits | 1.75% | Q1 2025 |
| Your store, mobile | Mobile orders ÷ mobile sessions × 100 | Your analytics period |
| Your store, desktop | Desktop orders ÷ desktop sessions × 100 | Your analytics period |
Rank the opportunity, not just the percentage gap
Start with device, then investigate landing page, acquisition channel, new versus returning visitor, and product category. Use country where delivery availability, currency or payment methods make the shopping experience materially different. Do not split every dimension at once. Begin with a broad segment, locate the loss, then narrow it. Excessively small groups make ordinary fluctuations look meaningful.
Volume decides which gap deserves attention. A segment with a modest gap can matter more than another with a wider gap when it carries far more sessions. Compare each segment with its own history before comparing it with a national figure, because a strong segment can still be deteriorating while a weak one is recovering.
For a hypothetical mobile segment, a 0.3-percentage-point improvement across 30,000 sessions would produce:
30,000 × 0.003 = 90 additional orders
That arithmetic assumes unchanged traffic and a genuine improvement across those sessions. It is not a forecast. It shows why a modest gain in a large segment can outweigh a more dramatic percentage change in a small one.
Use the video as a companion to the numerical breakdown, not as a substitute for checking your own reporting definitions.
For each segment, report sessions, add-to-cart rate, checkout-start rate, checkout completion and purchase conversion. Keep stage denominators explicit so you can distinguish weak product engagement from failure after checkout begins. Add average order value where the segment is commercially important, because conversion alone does not show revenue lost.
Start investigating the high-volume segment with the widest credible gap against its own comparable baseline. Use the national headline for context, never as the sole basis for its target. The blended rate is an output, not a target.
Where Checkout Loses Shoppers
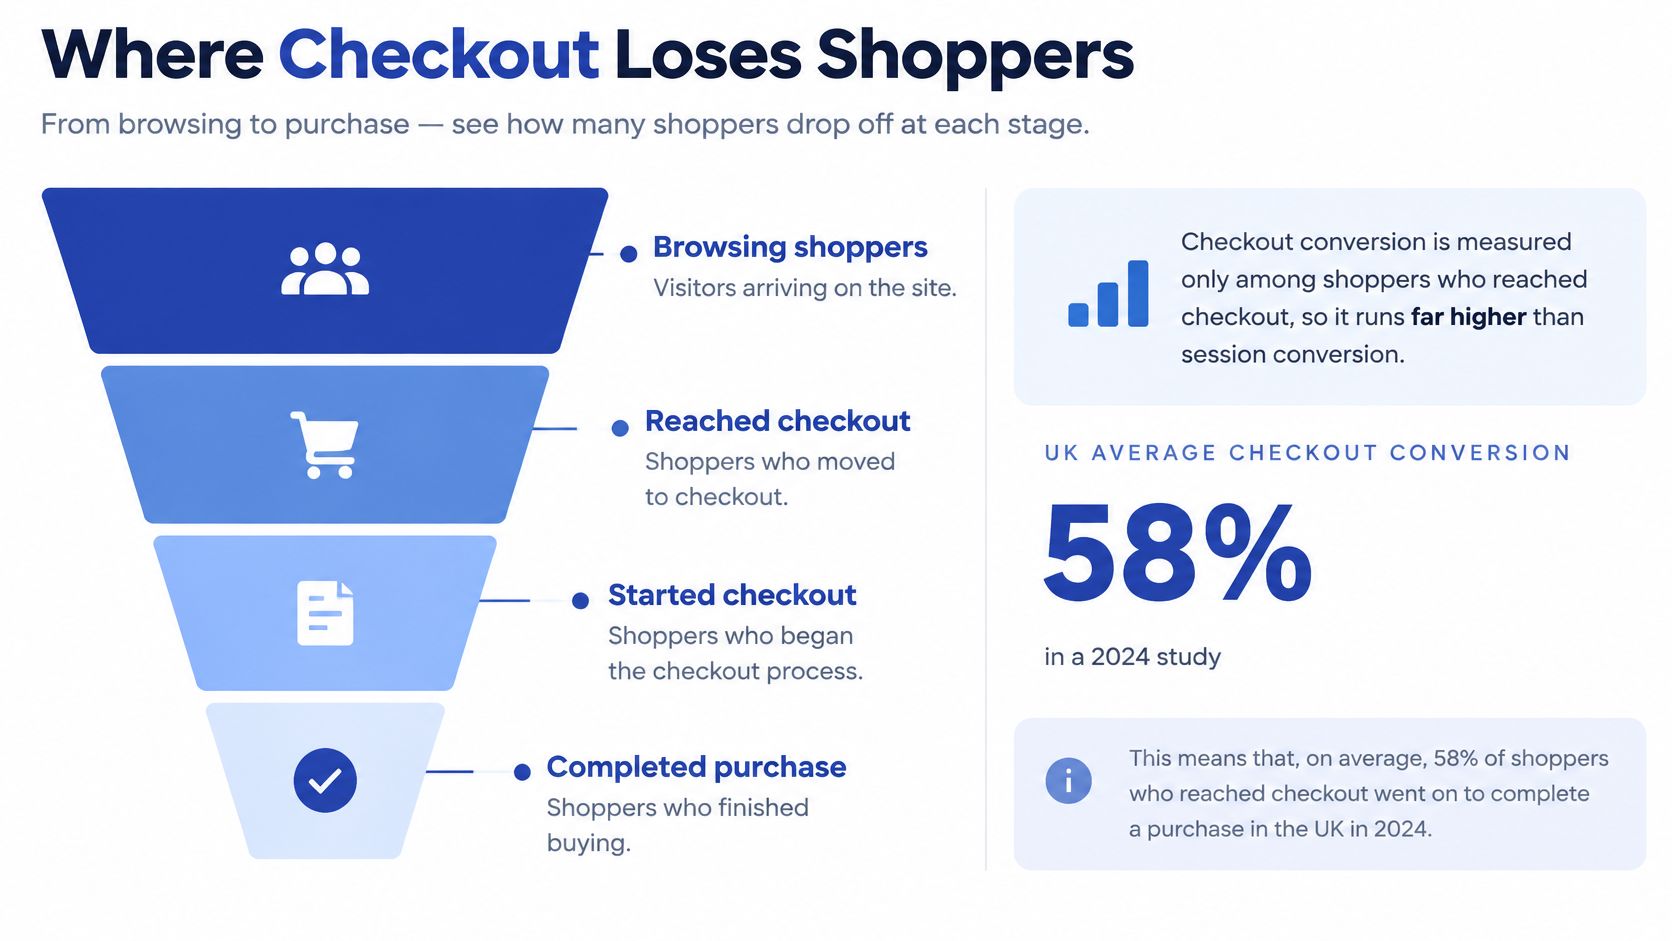
Checkout conversion measures completion among shoppers who reached checkout. Its denominator excludes everyone who left earlier, so it answers a different question from session conversion.
A 2024 UK retailer study, summarised in Compare Card Fees' ecommerce payment statistics, reported 58% average checkout conversion, with the following comparisons by express-payment availability, page layout and customer status.
Checkout conversion by checkout set-up
| Checkout set-up | Checkout conversion |
|---|---|
| Four express checkout options | 67% |
| No express checkout options | 52% |
| Single-page checkout | 61% |
| Multi-page checkout | 56% |
| Registered customers | 64% |
| Guest shoppers | 52% |
The express-option comparison represents a 15-percentage-point difference between the reported groups. It's an association, not proof that adding payment methods would produce the same improvement for your store.
Customer status needs similar care. Registered customers may already know the brand and have saved details; their stronger completion rate doesn't establish that registration causes the difference. Guests still represented 59% of orders in the same study, which is a reason not to interpret the comparison as support for removing guest checkout.
The funnel visual separates browsing from checkout activity. In your implementation, confirm whether reaching checkout and starting checkout are distinct tracked events.
Match the investigation to the stage
- Product page to basket: Compare product-view sessions with sessions containing an add-to-cart event. Inspect variant selection, stock messages, product information and button behaviour.
- Basket to checkout: Measure checkout starts among sessions with a basket addition. Check delivery-cost visibility and whether shoppers can understand the total before proceeding.
- Checkout start to purchase: Compare completed purchases with checkout starters. Test account requirements, address validation and error recovery.
- Payment attempt to success: Where payment reporting supports it, inspect failed authorisations, unavailable wallets and repeated attempts.
The Shopify checkout optimisation guide provides a practical framework for turning those observations into checkout changes.
Choose a focused test, such as exposing a relevant express-payment option or removing an unnecessary field. Run it through the store's purchase cycle and compare equivalent shoppers, preferably through a randomised experiment rather than an uncontrolled before-and-after comparison.
Revenue per Session and the Test That Matters
A conversion improvement can still reduce revenue. Discounting, cheaper product selection or a change in customer mix can increase order frequency while reducing the value generated by each visit.
Revenue per session = revenue ÷ sessions. When definitions align, it also equals conversion expressed as a decimal multiplied by average order value.
A higher rate with a worse commercial result
Return to the hypothetical store's starting position, then compare it with an illustrative alternative:
| Metric | Starting position | Changed experience |
|---|---|---|
| Sessions | 10,000 | 10,000 |
| Orders | 230 | 260 |
| Conversion rate | 2.3% | 2.6% |
| Average order value | £60.87, rounded | £48 |
| Revenue | £14,000 | £12,480 |
| Revenue per session | £1.40 | £1.248, or £1.25 rounded |
The changed experience produces more orders but less revenue from the same traffic.
Its arithmetic is:
0.026 × £48 = £1.248 revenue per session
260 × £48 = £12,480 revenue
A dashboard showing conversion alone would describe the change favourably. The revenue calculation supports the opposite conclusion.
Identify which lever changed
Conversion and order value are the direct mathematical components. Traffic quality influences both by changing who arrives and what they're prepared to buy.
- Conversion improves, order value falls: Inspect discount use, product mix, basket incentives and whether customers are splitting purchases.
- Both weaken after acquisition changes: Compare campaign and landing-page cohorts before blaming the storefront.
- Revenue per session improves: Check margin, acquisition cost and returns before treating the gain as profitable growth.
Decision rule: Keep a conversion-led change when revenue per session rises or holds, subject to margin and customer-experience guardrails. Investigate or reverse it when conversion rises but revenue per session falls.
Report the result weekly and by the segment exposed to the change. Include session volume, orders, revenue and promotion status, rather than presenting percentages without their underlying totals.
Use a controlled approach to ecommerce A/B testing where practical. Random allocation helps separate the effect of the experience from differences in the visitors who received it.
Don't declare a winner from an early favourable result. Allow purchases to mature, check uncertainty and account for cancellations consistently. Revenue per session is a better commercial check than conversion alone, but it still isn't a substitute for profit.
Set Your Segment Baseline This Month
Build a baseline that someone else on your team can reproduce. The useful deliverable isn't another headline percentage; it's a short list of measurable opportunities with a clear owner and a defensible test.
Build the working report
Export a comparable history. Use the last quarter as a practical starting window, then separate device and landing-page groups. Calculate from raw orders and sessions rather than averaging the dashboard's daily rates.
Annotate trading conditions. Mark promotions, stock shortages, acquisition changes and tracking releases. Keep disrupted periods visible instead of treating them as normal performance.
Add context beside each segment. Record its own historical rate, session volume, order value and revenue per session. Place the UK planning band in a separate reference column, not in a target column.
Use consistent customer definitions when separating new and returning visitors. A customer segmentation strategy is useful when the team needs shared rules for those groups and their intended shopping journeys.
Turn the report into a test
Rank opportunities by traffic exposure, the gap against a comparable baseline and the plausibility of fixing the observed problem. A large gap isn't automatically valuable if the visitors can't buy because the products aren't available in their market.
Choose the strongest opportunity and write a specific hypothesis. For example: Mobile shoppers who reach payment struggle to enter details, so exposing a relevant wallet should improve completed purchases without reducing basket value.
Then define the implementation and evaluation:
- Change: Describe exactly what the shopper will see differently.
- Population: Specify the eligible segment and exclusions.
- Primary measure: Use revenue per session for that population.
- Guardrails: Monitor completion, order value, errors and commercial costs.
- Decision: Record what evidence would justify keeping, revising or removing the change.
For an optional outside review, our Shopify audit identifies conversion blockers, slow page load times, poor mobile experience, broken code, SEO issues, problematic apps, inefficient theme code, checkout friction points and navigation problems.
Don't change several unrelated parts of the journey because they all look imperfect. A focused intervention gives the team a clearer explanation of the result and a more useful starting point for the next decision.
The number to beat is your segment's credible baseline, with a commercial improvement attached. A higher blended average isn't the objective if the store earns less from the visitors it attracts.
Grumspot offers growth-focused Conversion Rate Optimisation for Shopify and Shopify Plus stores, connecting funnel analysis with design and development changes. Visit Grumspot to discuss your segment-level results and identify a testable conversion opportunity, supported by a dedicated squad comprising a senior developer, a specialised UX designer and a CRO expert.
Want this kind of work on your store?
Send us the URL and what is slowing it down. We look at the store before we reply.
Related posts
Check out some similar posts.
- conversion rates for ecommerce
Conversion rates for ecommerce explained: UK benchmarks, how to calculate yours, and the checkout fi...
Read more
- ecommerce replatforming agency
Choosing an ecommerce replatforming agency? Learn what they do, replatforming signs, costs, timeline...
Read more
- print and mail API
Learn how a print and mail API works, what to look for in a UK-ready provider, and how to integrate ...
Read more
- Shopify maintenance agency
What is a Shopify maintenance agency and do you need one? Our 2026 guide covers services, pricing, h...
Read more