Conversion Rates for Ecommerce: UK Benchmarks and Fixes
- conversion rates for ecommerce
- ecommerce conversion rate
- CRO
- checkout abandonment
- UK ecommerce benchmarks
Only about 17 of every 1,000 visits to a typical UK ecommerce store end in an order. That's not a reason to chase more traffic first. It's a reason to ask what the other visits did, where they stopped, and whether your denominator is even comparable with the published average. For most Shopify and Shopify Plus merchants, conversion rates for ecommerce become useful only when you split them by device, channel, and funnel stage, then connect the weakest stage to delivery, checkout, or product discovery.
UK Conversion Rate Benchmarks at a Glance
The IRP Commerce UK ecommerce market dataset puts the average conversion rate at 1.68% in September 2025, or about 17 orders per 1,000 ecommerce visits. That basis matters. It's completed purchases divided by visits, not product views, basket creations, or sessions that showed buying intent without paying.
The same dataset reports 1.97% for September 2026, up 0.29 percentage points, or about 17.25% year over year. Confirm that later label before quoting it as current. Its label comes from the source itself, and a future-dated reading shouldn't be presented as settled fact without checking.
Small movements carry weight at this scale. Lift a store by one percentage point, from 1.68% to 2.68%, and 1,000 visits produce about 27 orders instead of 17. You haven't bought more traffic. You've converted ten more of the visits you already paid to win, through search, media, email, or repeat custom.
Read the measures separately
| Measure | Basis | Value | What it means |
|---|---|---|---|
| All-market UK average | Completed orders divided by ecommerce visits, September 2025 | 1.68% | About 17 orders per 1,000 visits |
| All-market UK average | Same basis, September 2026 | 1.97% | Up 0.29 points, about 17.25% year over year |
| Session-level UK figure | Sessions, separate dataset | 4.5–4.7% | Not directly comparable with order-based rates |
| One-point gain | 1,000 visits, order-based | 17 to 27 orders | Shows why small gains matter at scale |
Don't treat 1.68% as your target. Sector, price point, traffic source, device mix, and returning-customer share change what a healthy rate looks like. A premium, considered purchase bought after several research visits won't behave like a low-cost repeat order from email.
Practical rule: Use the all-market average as a reference point for scale, then build your own range from your category, devices, and channels.
No category, device, or landing-page benchmark is supplied by these UK figures. That gap is important. Your own segmented baseline, measured consistently, will tell you more than a blended national average ever can.
What Conversion Rate Measures and How to Calculate It
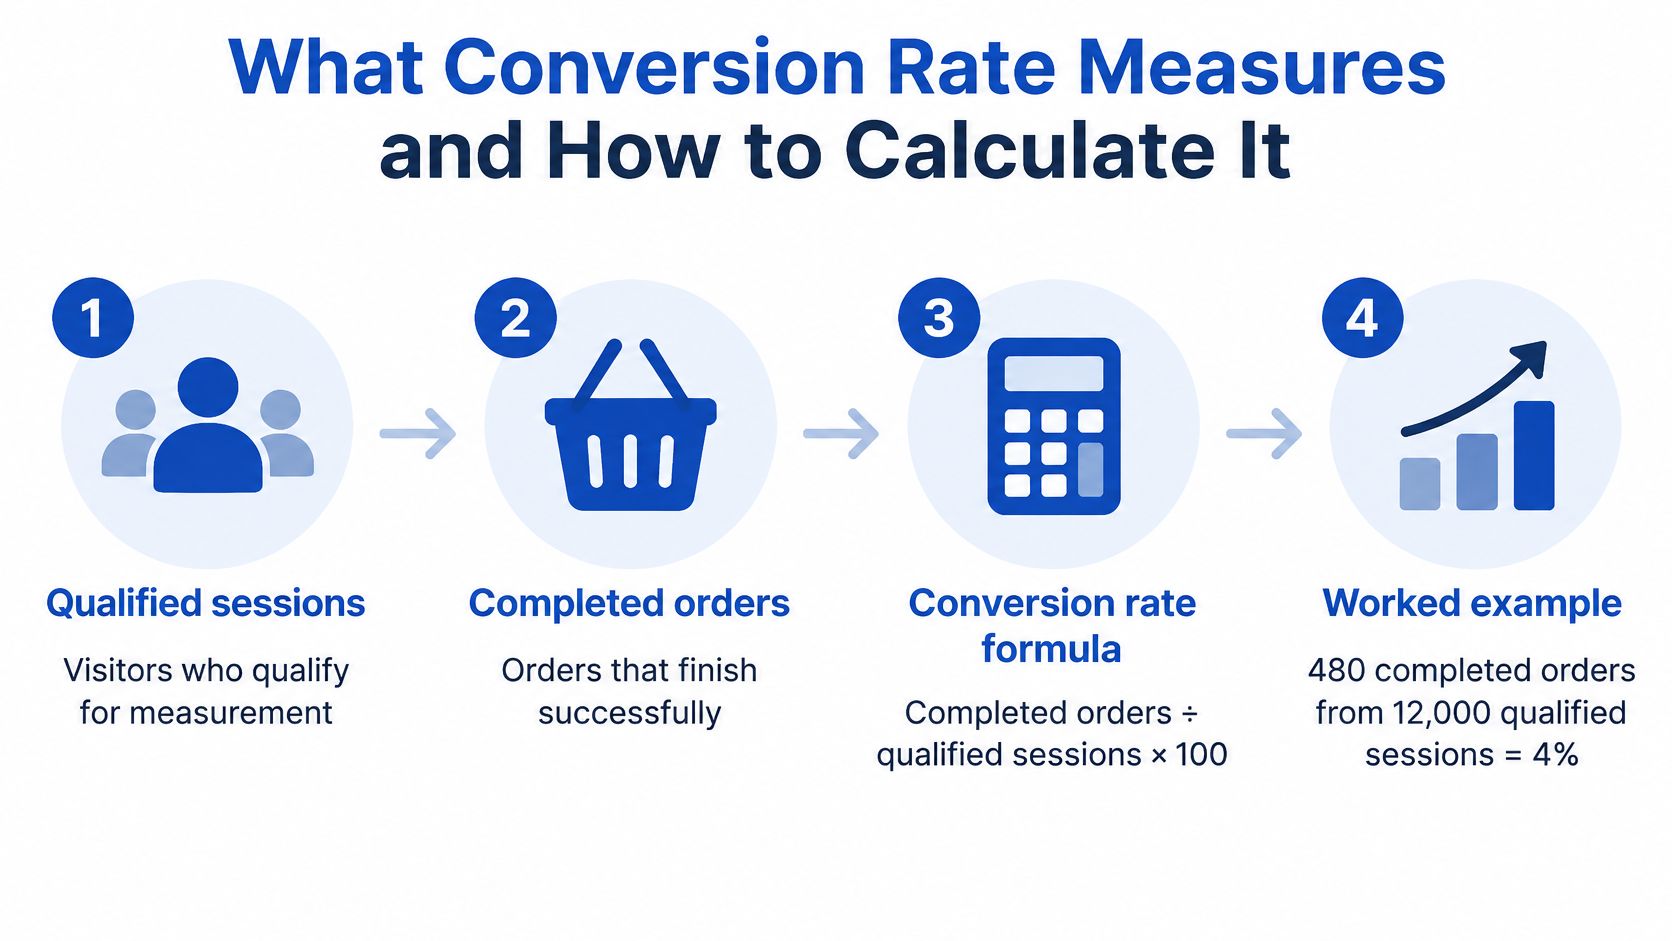
Conversion rate is the share of qualified sessions that end in a completed order. The formula is simple. Consistency is where stores go wrong, because teams change the denominator, include cancelled orders, or compare a seasonal peak with a quiet month and call the difference progress.
Conversion rate = completed orders ÷ qualified sessions × 100
Say you record 480 completed orders from 28,000 qualified sessions. Divide 480 by 28,000, then multiply by 100. You get 1.71%. That's a clean illustration, not a benchmark for your store.
Run the calculation the same way every time
- Export completed orders: Use Shopify Analytics or GA4 for the period, excluding cancelled and test orders, because they inflate the numerator.
- Count qualified sessions: Remove bot traffic and internal staff visits, because non-buying visits dilute the rate and hide real problems.
- Divide and multiply: Orders divided by sessions, multiplied by 100, gives you a rate on one stated basis.
- Split new and returning: Returning buyers lift blended rates and can mask weak first-purchase conversion.
- Compare like periods: Match the same period last year where possible, because Black Friday and other peaks otherwise look like improvement.
- Record the denominator: Write beside every figure whether it's based on visits, sessions, or people, so future readings stay comparable.
Definitions explain why published numbers clash. The UK ecommerce SEO statistics roundup notes IRP-derived reporting at 1.97% in September 2026 alongside a separate dataset reporting UK session-level conversion at 4.5–4.7%. Those figures aren't necessarily contradictory. Order-based, session-based, visitor-based, and platform-specific samples count different populations.
Keep stage metrics in their place
Add-to-basket rate and checkout-start rate are stage metrics. They show progress and leakage, but they don't answer whether qualified sessions became orders. Before you trust any result, reconcile completed orders with your revenue report and confirm the denominator is written down.
A rising rate can still be bad news. Deep discounting or low-quality paid traffic may lift orders while cutting contribution margin and repeat value. Read conversion beside average order value, contribution margin, repeat purchase rate, and customer acquisition cost. If profit per session falls while conversion rises, you haven't improved the business. You've bought a prettier headline.
Segmenting Conversion to Find the Real Problem
A blended rate hides the stores inside your store. The IMRG Digital Dashboard aggregates weekly revenue, orders, traffic, conversion rate, average order value, bounce rate, basket abandonment, and checkout abandonment from more than 220 leading retailers representing over £30 billion in online spend. That kind of comparable retailer view is far more useful than a generic global average.
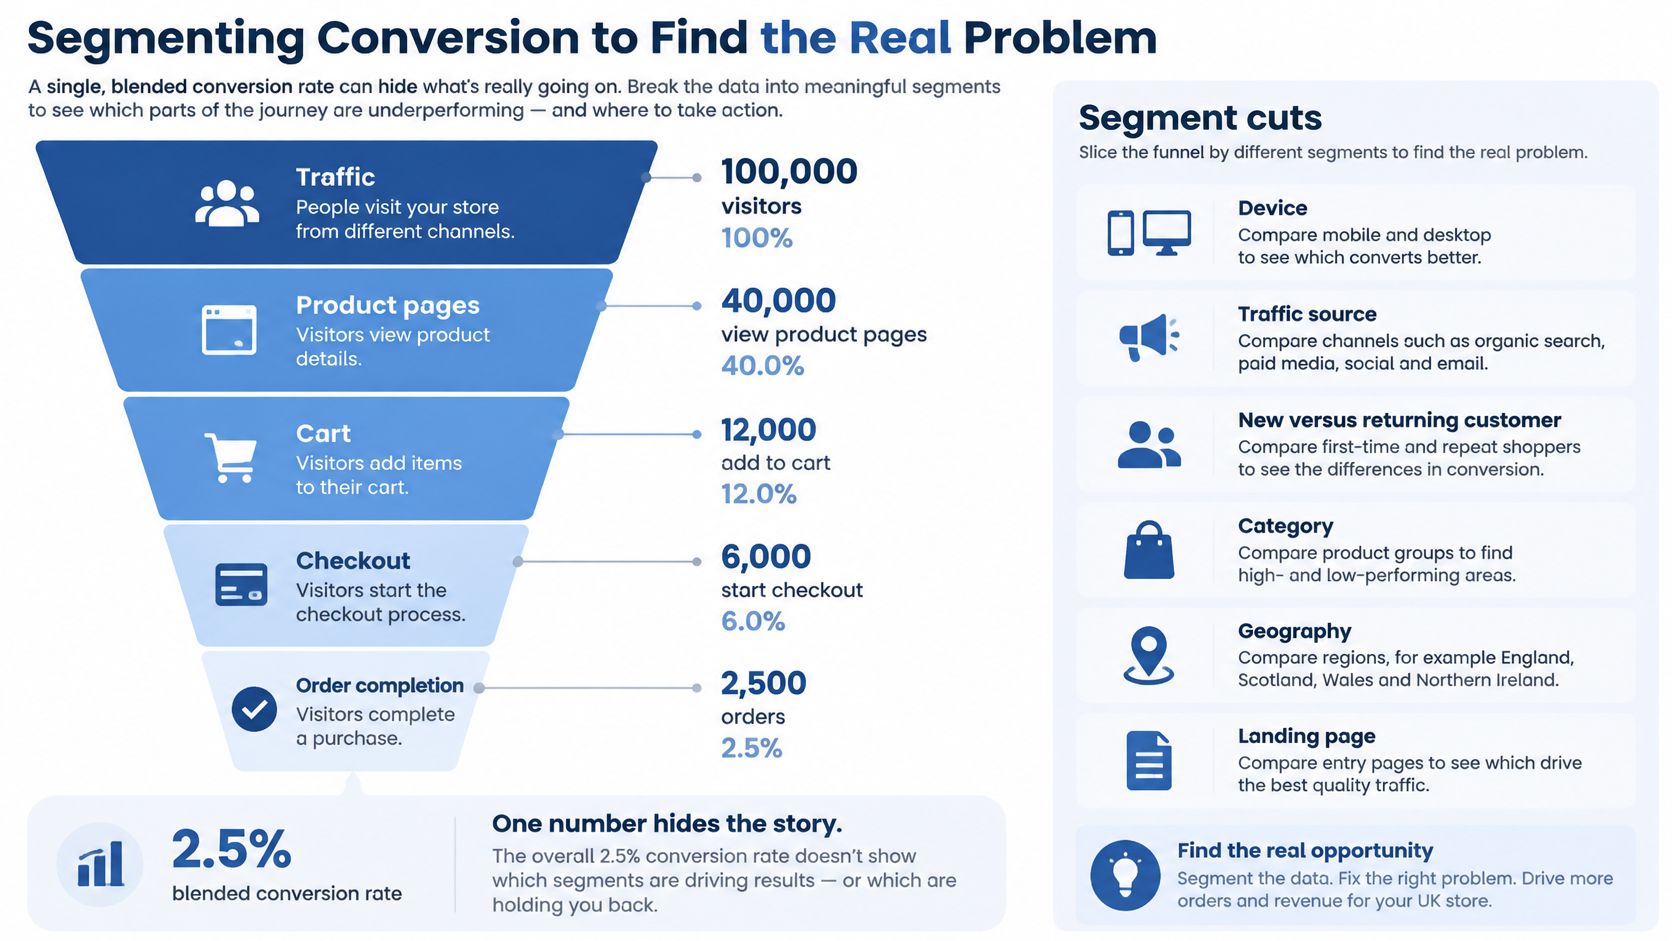
The operating model is completed orders divided by qualified sessions, segmented by device, channel, new versus returning customer, category, and geography. Add landing page to that list. A channel problem, a category problem, and a checkout problem can all produce the same disappointing blended figure.
This funnel visual shows why the segment cuts need to sit beside the stages, not in a separate report nobody opens.
Follow the stages in order
Instrument product view, add to cart, checkout start, payment attempt, and order as separate steps. A falling add-to-basket rate points toward merchandising, pricing, product-detail quality, or search relevance. Shoppers saw the range but didn't find a reason, or the right product, to commit.
A stable add-to-basket rate with falling checkout completion points elsewhere. Look at delivery disclosure, payment failures, form complexity, and trust. The buying intent was there. Something late in the journey taxed it away.
Say a store's paid-social visitors convert at 0.6% in a hypothetical review, while organic search visitors convert at 2.9%. That's not automatically a store-wide failure. It may be a mismatch between the social promise and the landing page, weaker intent arriving on mobile, or product pages that don't answer the question the advert raised. Each diagnosis leads to different work.
The short video below is useful for seeing funnel diagnosis discussed as a sequence, rather than as a single dashboard number.
Turn weekly movement into a backlog
Review cohorts each week and sort findings into two practical lists. Put product information and search relevance in one when browse-to-cart weakens. Put checkout simplification and payment handling in the other when cart-to-order weakens.
Don't react to every wobble. Act when a segment shift persists for two or three weeks, after you've checked traffic mix, promotions, stock, and tracking changes. Persistence separates a real leak from a noisy weekend.
Checkout and Delivery Friction That Cap Conversion
Checkout is where high intent meets avoidable friction. The scale of that loss should set your priorities before you commission a redesign or increase acquisition spend.
| Measure | Segment | Value | Note |
|---|---|---|---|
| Basket abandonment | All UK baskets, late 2024 | 74% | Baskets that did not become orders |
| Basket abandonment | Mobile | 76% | Higher than desktop |
| Basket abandonment | Desktop | 67% | Lower than mobile |
| Checkout completion | All UK ecommerce, 2024 | 58% | Average across checkouts |
| Checkout completion | Single-page checkout | 61% | Higher than multi-page |
| Checkout completion | Multi-page checkout | 56% | Lower than single-page |
| Recovery after abandonment | Email or remarketing | Below 5% | Small share of lost demand |
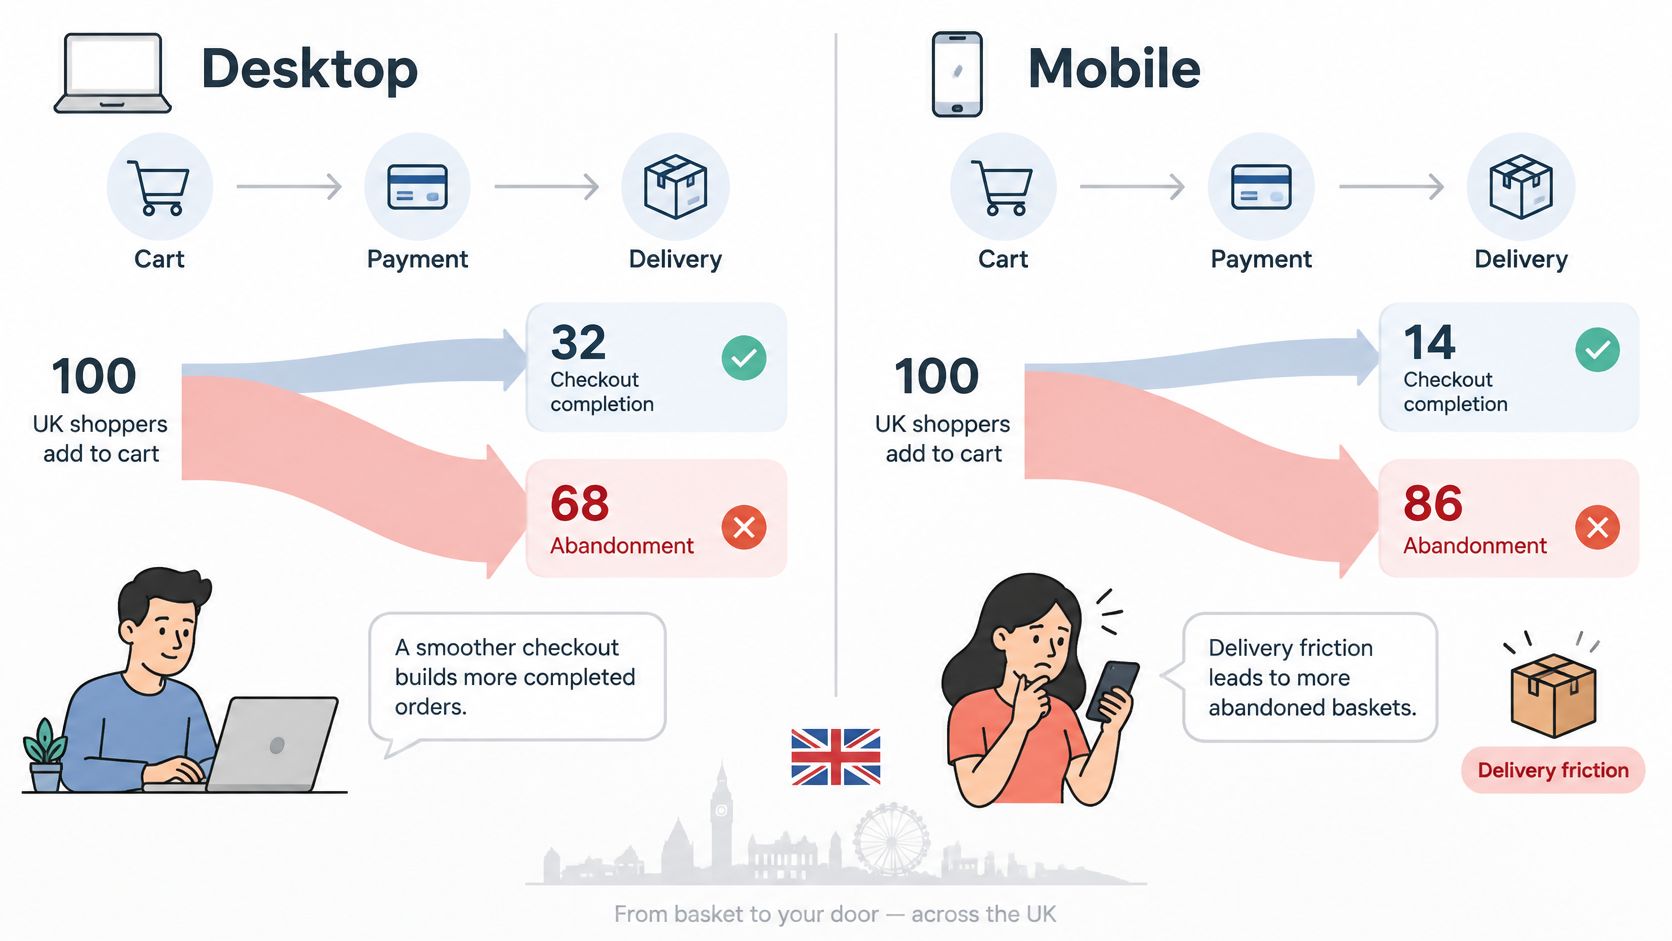
The Leeds Beckett University Retail Institute checkout abandonment research found approximately 74% of baskets created in the UK during late 2024 did not become completed orders. Abandonment reached 76% on mobile against 67% on computers. A responsive layout doesn't solve that gap if shoppers still face cramped forms, awkward address entry, slow payment steps, or delivery charges revealed too late.
The leading causes were unexpected delivery charges, mandatory account creation, complicated checkout flows, and insufficient payment-security trust. Recovery rates were below 5%, so email and remarketing recover only a small fraction of lost demand. Prevention at checkout is worth more than an elegant recovery sequence.
Format matters too. The Ecommpay and IMRG study reported UK ecommerce checkout conversion averaging 58% in 2024, with single-page checkouts at 61% compared with 56% for multi-page checkouts. Fewer transitions won't rescue unclear costs, but needless steps give doubt more places to grow.
The comparison below underlines why desktop and mobile checkout need separate instrumentation and separate fixes.
Delivery is often the real constraint
The DHL e-commerce trends report 2025 found 80% of British shoppers abandon a purchase when their preferred delivery option is unavailable. In separate 2025 research covered there, 40.6% of UK consumers had abandoned an online purchase during the previous year because of delivery concerns. Among those respondents, high shipping cost was cited by 78.5% and slow delivery by 41.6%.
A polished product page can't compensate for a delivery promise shoppers don't believe, can't afford, or only discover at payment.
That changes the order of work. Showing delivery dates and total costs earlier, especially on mobile, may produce more than polishing imagery or adding another payment logo. Still, payment choice matters when the shopper reaches that step. Review your Shopify payment methods against device behaviour and failed payment attempts, rather than adding every available option and creating a crowded choice.
Social commerce makes consistency harder to dodge. DHL reports 63% of British shoppers have purchased through social media, and 53% expect social platforms to become their primary shopping destination by 2030. Treat that 2030 figure as an expectation reported by shoppers, not a guaranteed outcome. Your delivery cost, dispatch cut-off, collection choices, and returns message need to match across social landing pages, product pages, cart, and checkout.
Test delivery-message placement, free-shipping threshold messaging, click-and-collect visibility, postcode-based estimates, and returns reassurance. Judge each test by margin as well as completion. Free delivery that lifts orders but destroys contribution on low-value baskets isn't a conversion win.
Tactics That Lift Conversion, Ranked by Evidence
Rank work from the highest-intent stage backwards. A shopper at payment has already chosen a product, accepted much of the price, and invested time. Removing friction there usually beats trying to persuade colder visitors at the top of the funnel to care more.
| Tactic | Funnel stage | Metric to watch | Owner |
|---|---|---|---|
| Show delivery cost and date before checkout | Cart and checkout start | Checkout completion rate | UX design |
| Offer prominent guest checkout | Checkout start | Checkout completion rate | Development |
| Cut checkout form fields | Checkout start to order | Checkout completion rate | UX design |
| Keep cart persistent across devices | Cart to order | Recovered carts | Development |
| Improve product information and search relevance | Browse to cart | Add-to-basket rate | Merchandising |
| Add mobile-first payment options | Payment | Mobile checkout completion | Development |
| Target discounts with a margin guardrail | Order value | Average order value and margin | Marketing |
| Instrument funnel by device and stage in GA4 | All stages | Stage conversion by device | Analytics |
Start with delivery transparency and checkout simplicity when completion is the gap. Show the full cost before shoppers commit personal details. Make guest checkout obvious, preserve entered information after an error, and remove fields you don't need before payment. Ask for marketing preferences and account creation after the order, when they can't block revenue.
Persistent carts deserve attention because shoppers don't complete every journey on one device. If a basket built on a phone disappears on a laptop, you've forced a returning shopper to repeat work. That isn't a persuasion problem. It's basic continuity.
Fix browse-to-cart without guessing
Weak add-to-basket performance calls for better product information, clearer variant and sizing guidance, credible availability, and more relevant search results. Our guide to ecommerce site search is relevant here because searchers often arrive with a specific product, attribute, or problem in mind. If search returns loosely related products while filters bury the obvious match, conversion suffers before checkout gets a chance.
Product pages should answer the questions that stop commitment. State materials, dimensions, compatibility, delivery timing, returns terms, and what's included. Put key answers near the buying controls, not only in tabs or footer policies. Reviews help when they address fit, durability, and use cases, not when they're a wall of generic praise.
For a broader view of testing sequence and checkout discipline, it's worth reading how to improve checkout conversions with Samba. Use external frameworks as prompts, then let your stage data decide which idea earns development time.
Keep the caveats beside the work
Discounts need a margin guardrail. A code can lift conversion and average order value while still reducing profit if it trains full-price buyers to wait or pulls forward low-value orders. Set the minimum acceptable contribution before launch.
Low-quality traffic creates a similar trap. More orders from visitors who return products, never buy again, and cost heavily to acquire may not raise customer lifetime value. Pair every tactic with average order value and repeat purchase checks.
Smaller stores also need patience. An A/B test with too few orders produces confident-looking noise. Change one thing per test, target the stage with the largest segment gap, and wait for a meaningful order count before you decide.
Choose Your First Conversion Test
Pick one change tied to one funnel stage and one segment. A broad redesign tested all at once may move the number, but it won't teach you which element did the work or which element damaged another segment.
- Pull a 90-day baseline: Export completed orders and qualified sessions using your agreed denominator, split by device, channel, and customer type.
- Find the largest stage gap: Compare segments across product view, add to cart, checkout start, payment attempt, and order.
- Choose one matching tactic: Select the ranked tactic that addresses that stage, not the easiest visual change available.
- Set success and guardrails: Define the main metric plus an average order value or margin limit before launch.
- Run to a meaningful order count: Don't stop because week one looks good, and allow smaller stores more time.
- Roll out or revert: Act after the persistence check, then document the segment, dates, denominator, and result.
A structured approach to ecommerce A/B testing helps you avoid changing the audience, offer, and page at the same time. Keep the test readable. If every variable moves, the result can't guide the next decision.
Say mobile checkout shows the largest gap. Your first test could be a single-page mobile checkout with delivery cost visible before payment, measured against the 90-day mobile baseline and protected by an average order value guardrail. That test has one shopper problem, one stage, and one clear commercial question.
If you can't pull the baseline cleanly, fix measurement first. We integrate Google Analytics 4 with Shopify stores and configure e-commerce tracking, so stage data is trustworthy before testing starts. A store audit can also identify conversion blockers, slow page load times, poor mobile experience, problematic apps, checkout friction points, and navigation problems.
Start where qualified shoppers stop, not where the design looks oldest.
That discipline turns conversion from a vanity benchmark into an operating system. You'll spend less on broad redesigns and more on the specific delivery, search, product, or payment problem that's costing orders now.
If your segmented funnel shows a clear leak but your team doesn't have the design, development, and testing capacity to fix it cleanly, Grumspot offers Conversion Rate Optimisation with growth-focused strategies for Shopify and Shopify Plus stores. Visit Grumspot to discuss an audit and a first test based on your own mobile, channel, and checkout data, not a blended benchmark.
Want this kind of work on your store?
Send us the URL and what is slowing it down. We look at the store before we reply.
Related posts
Check out some similar posts.

- Shopify performance optimization
Boost your Shopify store's speed & sales with our Shopify performance optimization guide. Audit, fix...
Read more
- DTC brand Shopify store
Build a high-velocity DTC brand Shopify store. This practitioner's guide covers strategy, Shopify Pl...
Read more
- Shopify checkout optimisation
Unlock higher conversions with our expert Shopify checkout optimization guide. Learn practical UX ta...
Read more