Core Web Vitals Optimization: A Practical Playbook
- core web vitals optimization
- LCP INP CLS fixes
- Shopify speed optimization
- field data monitoring
- ecommerce performance
Launched
August, 2026

A green Lighthouse score doesn't mean your Shopify store passes Core Web Vitals. It means one simulated page load looked healthy under controlled conditions. Google evaluates the experience delivered to real visitors, and that experience includes different phones, networks, locations, browsers, third-party scripts, personalisation, and the messy interaction patterns that synthetic tests can't reproduce.
That distinction is the centre of effective core web vitals optimization. UK benchmark data shows that performance is improving, but it remains incomplete. One 2026 analysis found that 66.6% of UK WordPress mobile origins passed Core Web Vitals, compared with 66.5% on desktop, while only 41.4% achieved good TTFB on mobile (UK Core Web Vitals field data). A store can therefore look fast in development and still frustrate customers in production.
The practical response isn't to chase a perfect lab score. It's to diagnose field data, prioritise the bottleneck that affects the largest number of real users, and keep checking whether each release improves the experience that Google and customers see.
Why Your Lighthouse Score Is Lying to You
A high Lighthouse score is useful, but it isn't proof of passing Core Web Vitals. Lighthouse runs a controlled test against a single URL, with a defined device profile, network simulation, and page state. Search Console and CrUX represent actual Chrome users whose devices, connections, locations, and behaviour vary considerably.
Core Web Vitals are judged using real-user field data, with the 75th percentile of visits determining whether a metric reaches the relevant good range. The data also uses a 28-day rolling window, so a deployment won't instantly replace the historical experience in your report. Google's CrUX methodology and diagnostic tools explain why field data should be treated as the source of truth rather than a lab score alone.
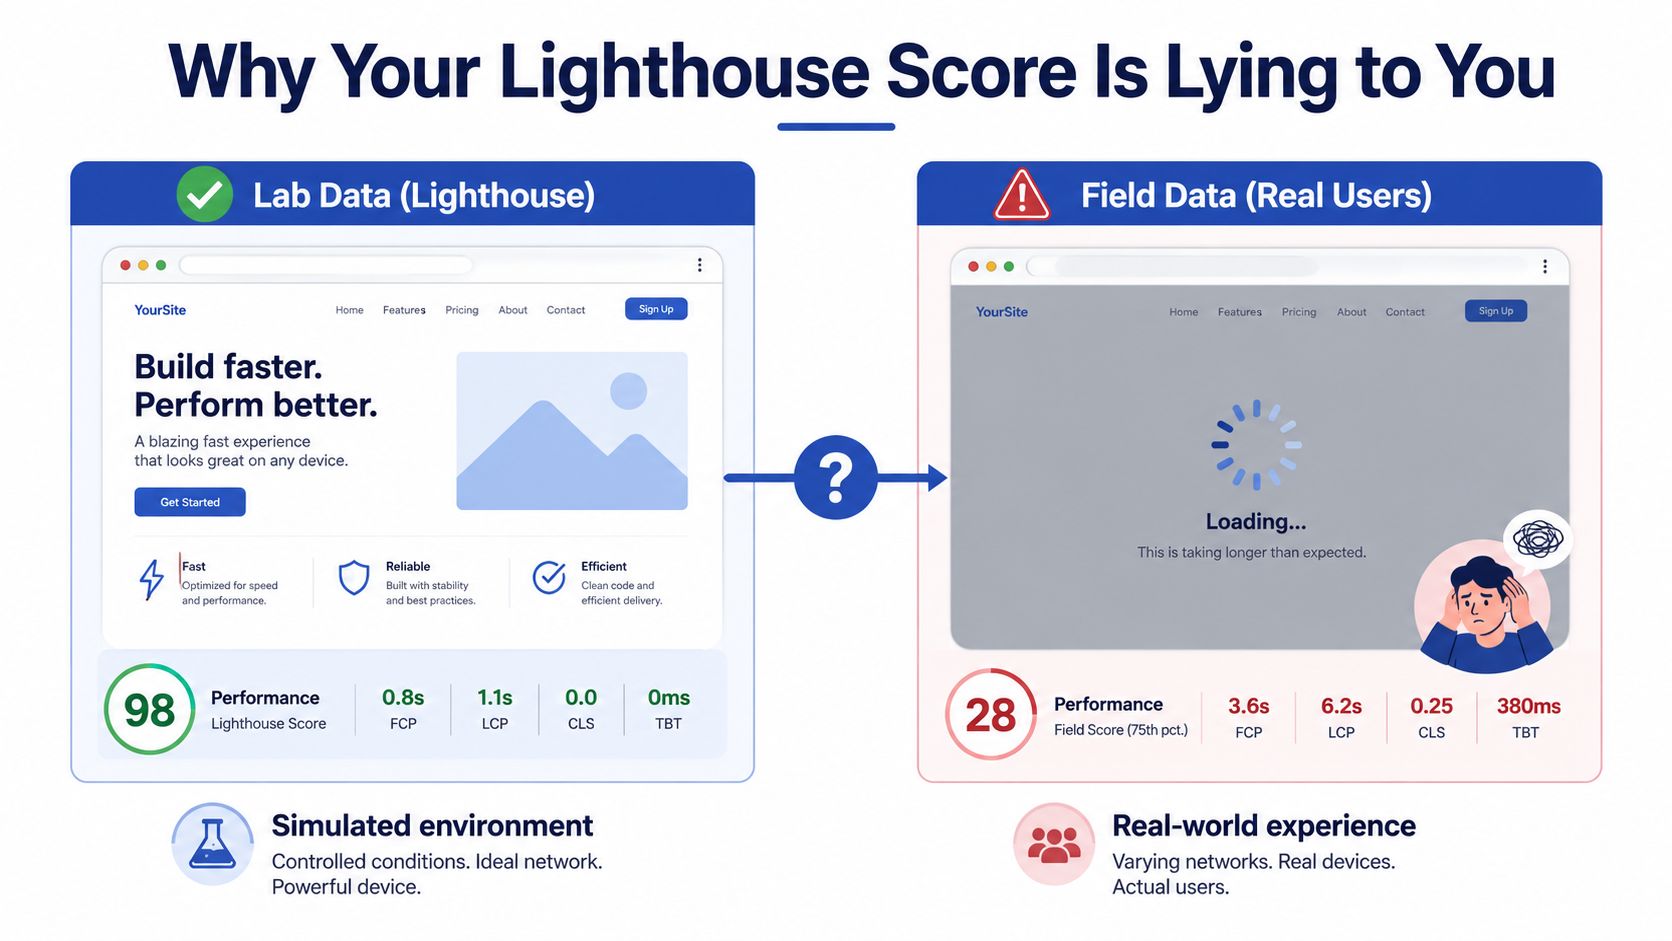
The conditions that lab tests remove
Your staging site probably has a fast office connection, a clean browser cache, no campaign traffic, and a small set of applications enabled. A real shopper may open a product page on a mid-range mobile device while a consent manager, reviews widget, analytics tag, chat tool, recommendation engine, and payment script all compete for the main thread.
The cart state matters too. A product page tested before personalisation or variant selection can behave very differently after the shopper interacts with size selectors, subscriptions, bundles, delivery estimates, or promotional pop-ups. Lighthouse may capture the initial render, while INP depends on what happens when someone taps and waits for the interface to respond.
This is why a score-chasing workflow fails. Teams remove enough visible weight to improve a single test, then ship another app, banner, video, or experiment that changes the production experience. The lab score remains a snapshot. Field data reveals the accumulated cost.
Practical rule: Use Lighthouse to locate likely causes. Use Search Console, CrUX, or RUM to decide whether the fix helped real users.
What to change in your mindset
Treat every synthetic result as a diagnostic clue, not a compliance certificate. A useful audit compares the same template across lab and field data, then asks why the gap exists.
For Shopify stores, inspect the critical rendering path before tweaking isolated assets. The question isn't “How do I make this page score higher?” It's “Which production condition causes enough visitors to fail, and which change removes that condition without damaging merchandising or conversion?”
Understanding the Metrics That Matter
On a Shopify product-page audit, these three metrics map to three different customer risks: LCP shows whether the main product content appears promptly, INP shows whether taps and selections receive a timely response, and CLS shows whether the page moves under the shopper. TTFB isn't one of the three Core Web Vitals, but it influences how soon the browser can begin rendering meaningful content. Treating the measurements as isolated scorecards hides the dependencies between them.
LCP measures when the largest visible content element appears, often a hero image, product image, video, or prominent text block. A slow server response delays the start, while render-blocking resources and poorly prioritised media delay completion. INP measures responsiveness across interactions, so a page can load acceptably and still fail when a shopper opens a variant selector or adds an item to the cart. CLS measures unexpected movement caused by images, promotional bars, fonts, carousels, and app content arriving late.
The thresholds are established. LCP is good at 2.5 seconds or below, INP at 200 milliseconds or below, and CLS at 0.1 or below, as described in Google's Core Web Vitals guidance through Adobe's Web Vitals explanation.
A working benchmark view
The verified UK data does not provide the ecommerce medians or metric-specific medians often included in generic performance articles. Use the available benchmark evidence to identify where stores commonly fall short, rather than filling those gaps with unsupported figures.
| Metric | Threshold | Mobile Median | Desktop Median | Common Failure Points |
|---|---|---|---|---|
| LCP | 2.5 seconds or below for good | Not provided | Not provided | Hero media, server response, blocking CSS and JavaScript |
| INP | 200 milliseconds or below for good | Not provided | Not provided | Long tasks, app scripts, cart and variant interactions |
| CLS | 0.1 or below for good | Not provided | Not provided | Unreserved media, banners, fonts, widgets and carousels |
| TTFB | No Core Web Vitals pass threshold stated here | Not provided | Not provided | Origin processing, uncached requests and backend queries |
A 2026 UK-focused summary reported that 29% of UK sites still didn't meet Core Web Vitals standards overall, while 70% of UK search results had good LCP and the UK LCP pass rate rose from 73% to 75% over the tracked period (UK Core Web Vitals statistics). The gap is instructive. Strong LCP does not produce a passing result if INP, CLS, or server response remains weak, which helps explain why synthetic scores can look healthy while mobile field results remain poor.
How Shopify failures usually present
A frequent LCP mistake is applying lazy loading to the first visible product or collection image. Lazy loading suits content below the fold, but it can postpone the asset that defines LCP. Use responsive image variants and deliberate priority for the hero, then lazy-load content beginning below the initial viewport. Practical image optimization for the web depends on placement as well as compression.
INP issues usually appear after the initial render. A review app may attach listeners across a product grid, a tracking script may schedule long tasks, or a theme component may rerender too much of the page after a variant change. CLS often comes from the same app ecosystem, especially when a widget inserts content without reserving space.
Fix the template or injection point first. Arbitrary delays may hide the symptom in a lab test while leaving the interaction or layout shift intact for shoppers.
Diagnosing Problems with Field Data
Field diagnosis starts in Google Search Console, not Lighthouse. Open the Core Web Vitals report and separate mobile from desktop. The report groups URLs by patterns and shared issues, so a failing product template may represent many product URLs even when you've only tested one page manually.
The grouping is helpful, but it can also mislead. “Some URLs” means the issue affects part of the group, while “All URLs” indicates the reported problem applies across the group. Open representative examples, compare their templates, and identify whether the problem comes from a shared theme section, an app injection, a media pattern, or a backend response.
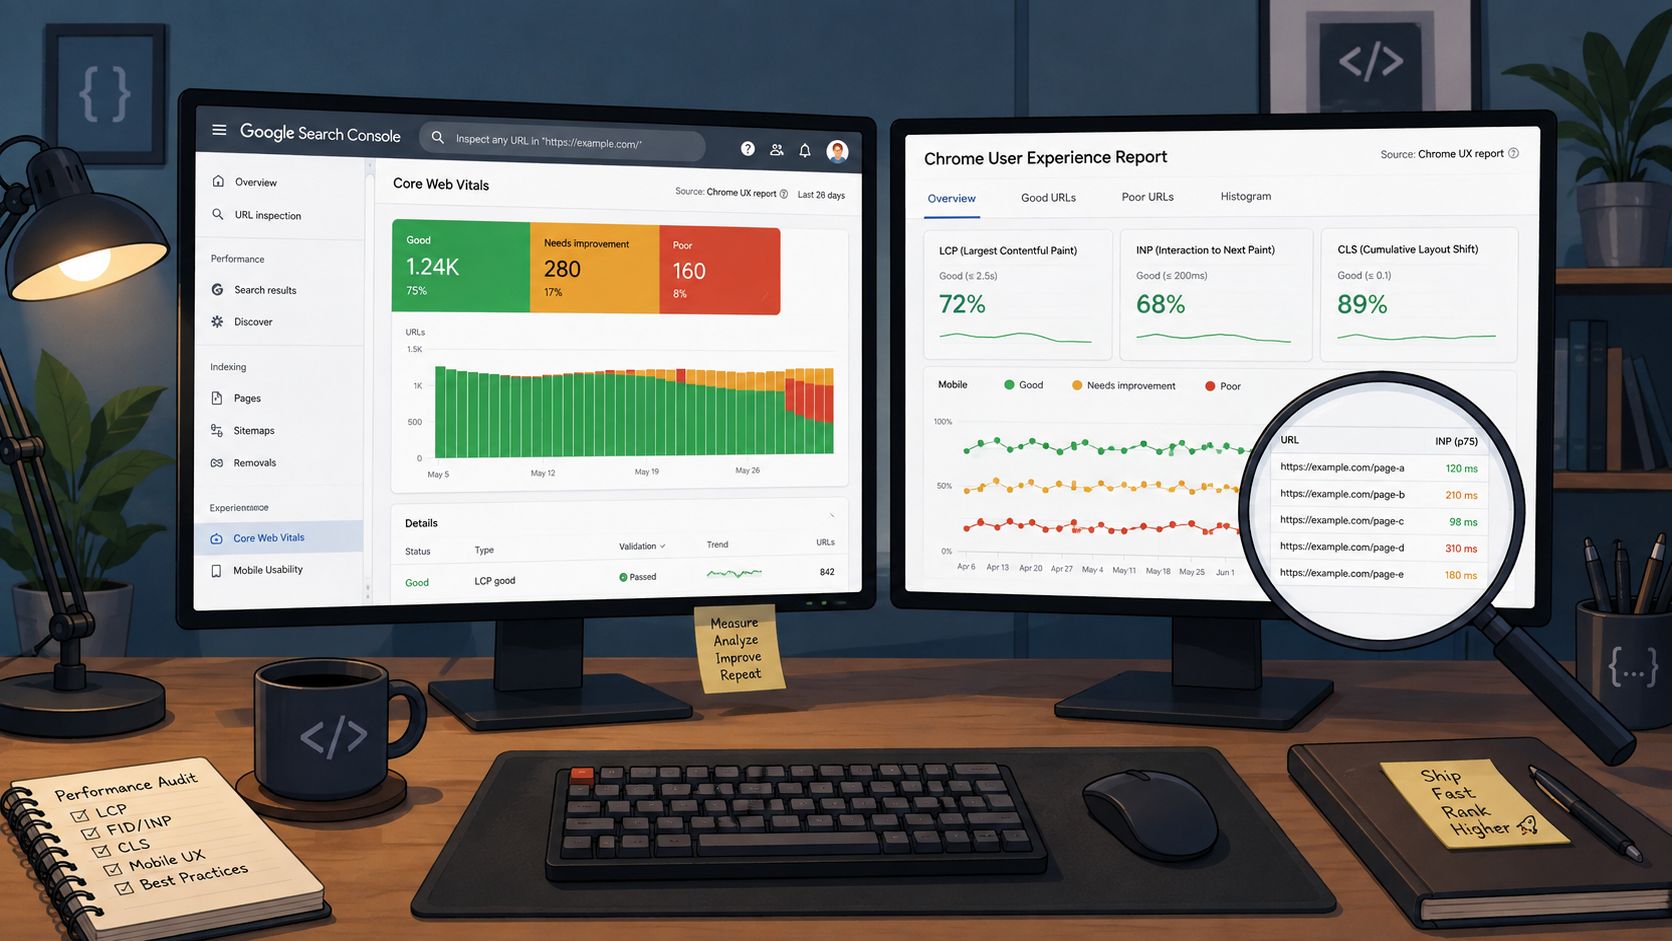
A field-data workflow that avoids guesswork
Start with the failing device class. Mobile commonly needs more attention because device and network constraints expose JavaScript, media, and server weaknesses that desktop hides.
Identify the metric. Don't fix images because the page “feels slow” if the field issue is INP. Don't remove scripts if CLS comes from a banner that changes height after render.
Inspect URL groups. Compare a product page, collection page, landing page, and content page where relevant. A single Lighthouse result can't represent every template.
Use PageSpeed Insights for diagnosis. Its field-data panel can confirm whether the public URL has enough data and its lab diagnostics can suggest blocking resources, oversized media, or main-thread work.
Compare CrUX and Search Console. CrUX provides public real-user experience data for eligible origins and pages. Search Console turns related performance problems into URL groups that are easier to prioritise for a site team.
Deploy one coherent fix set. Record the affected templates, metric, change, and release date. Then use Search Console's validation workflow when the issue has been addressed.
The important constraint is time. Because field reporting uses a rolling window, the report won't instantly reflect a release. A fix can be technically correct and still appear unchanged until enough new user experience data enters the window.
Segment before you rewrite the theme
A mobile LCP problem across UK visitors points towards shared hosting, edge delivery, theme weight, or media handling. A problem limited to one template points towards that template's sections or application dependencies. If the same issue appears only after interaction, capture the exact action and inspect the event handlers and long tasks around it.
For deeper analysis, use CrUX data where your access and reporting setup support it, then join it with your own page taxonomy. Your internal RUM can add context that aggregated reports can't, such as the affected browser, template, interaction, or campaign. Don't export data just because it's available. Export it to answer a decision, such as which template deserves the next performance sprint.
Prioritized Fixes for Ecommerce Stores
The most productive sequence for many UK ecommerce audits is TTFB, then LCP, then INP, then CLS. This order isn't a rigid law. It reflects the way backend delay can hold back visual loading, while client-side scripts and unstable components create separate problems that need their own treatment.
A recent benchmark dashboard cited in UK guidance reported 55.7% of origins passing all three Core Web Vitals, with 68.3% good LCP, 87.1% good INP, 80.9% good CLS, and 44% good TTFB (UK SME Core Web Vitals guidance). The lower TTFB result explains why visual tuning alone often reaches a ceiling.
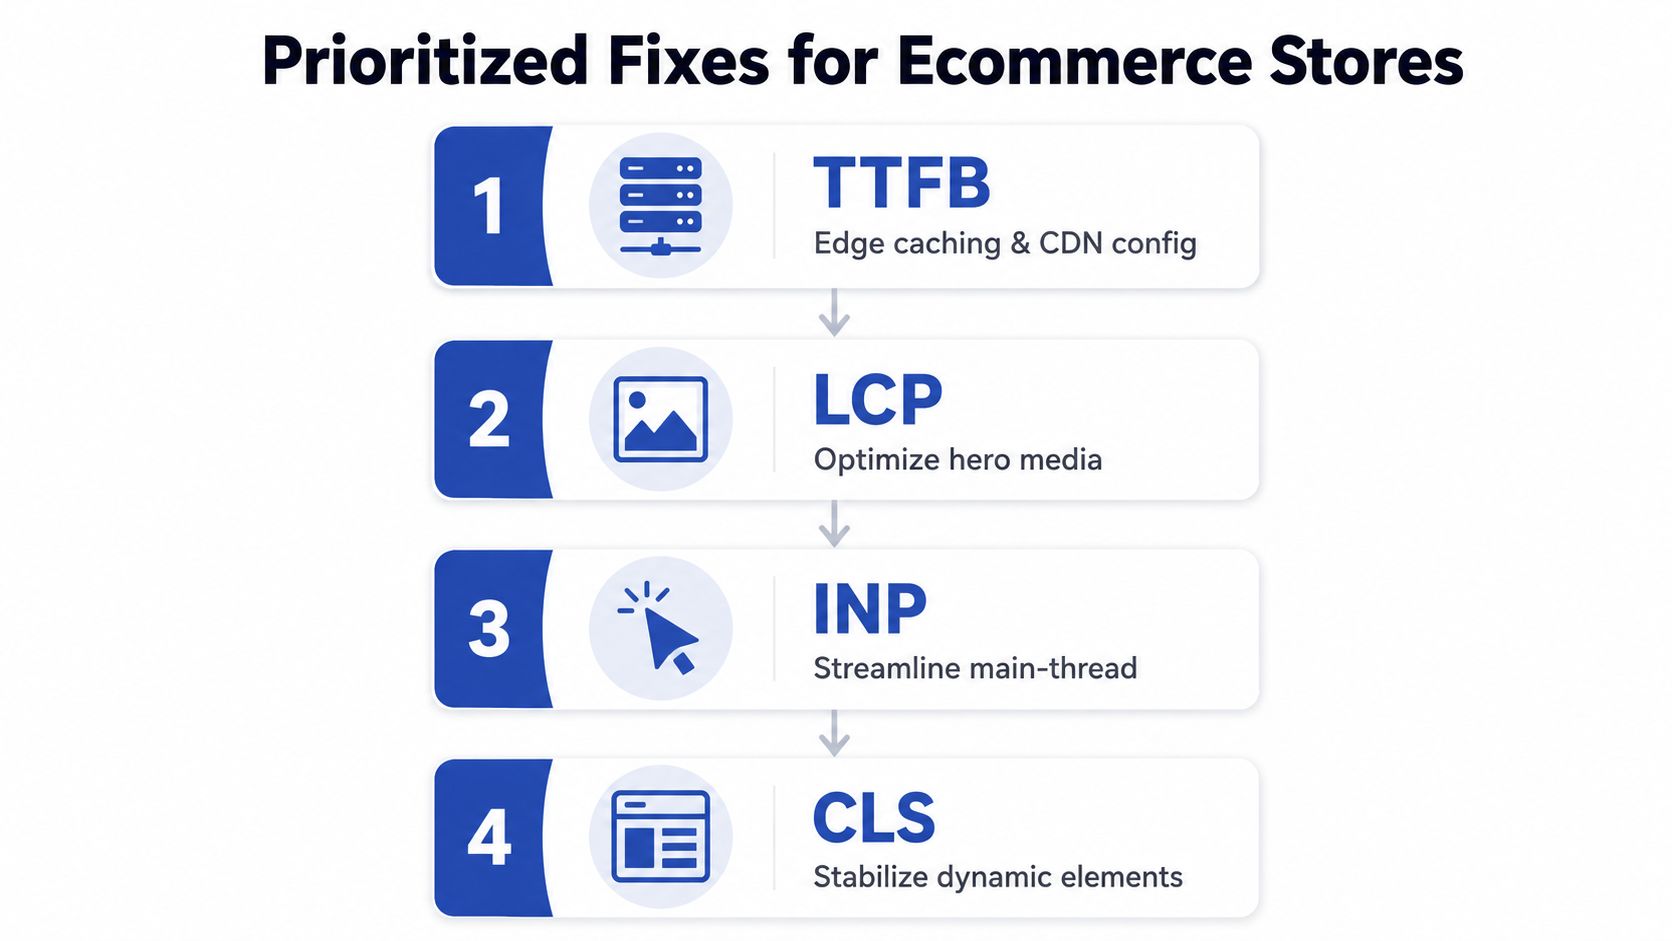
Start with TTFB
Review cache behaviour, origin processing, application requests, and backend queries before rewriting front-end components. On Shopify Plus, you'll have less control over platform internals than on a self-hosted stack, so focus on theme requests, app calls, storefront API usage, and what can be served efficiently through Shopify's delivery layer.
Reduce unnecessary queries and avoid requesting data that isn't needed for the first view. Where a CDN or edge layer is part of your architecture, configure caching deliberately for content that can safely be reused. Personalisation, inventory, pricing, and account data need careful cache rules, but “dynamic” doesn't automatically mean every response must travel to origin.
Then make LCP intentional
Find the element reported as LCP in PageSpeed Insights and trace its path from HTML to pixels. If it's the hero image, make it discoverable early, serve an appropriate responsive variant, and avoid lazy loading it. Use srcset, suitable dimensions, and fetchpriority where the theme architecture supports them.
In theme.liquid, check which styles and scripts block the first render. Remove unused dependencies, load only the CSS required for the initial view, and question every app that injects code site-wide. The right fix may be to restrict an app to product pages rather than remove it entirely.
A frequent trade-off is merchandising versus loading priority. A large autoplay video may support the brand experience, but it also competes with the element that defines LCP. Test a lightweight poster or static image first, then load richer media after the initial content is usable.
Reduce INP on real interactions
Profile the actions customers take, not just the page load. Variant selection, predictive search, drawer carts, filters, subscriptions, and discount-code controls are common sources of expensive JavaScript work.
Break long tasks into smaller units, defer non-essential third-party scripts, and prevent a single interaction from rerendering the entire page. Replace JavaScript-driven visual effects with CSS where possible. Review apps, chat tools, analytics tags, and tracking pixels should earn their main-thread cost. If a script doesn't support a clear business requirement, remove it. If it does, load it later or limit it to the templates that need it.
For a practical introduction to technical SEO with Keyword Kick, use the concepts as a checklist, then validate every change against your own field experience rather than treating general recommendations as a finished implementation.
Finish with CLS stability
Reserve dimensions for product images, promotional bars, embedded reviews, recommendation blocks, and other dynamic content. Set image width and height or use a stable aspect-ratio container so the browser can allocate space before the asset arrives.
Audit fonts and late-loading components as well. A fallback font can alter line wrapping, while a promotional message that appears above the product grid can move every element below it. Use stable containers and avoid animations that change layout. If a marketing team wants a new banner, require its dimensions and loading behaviour before it reaches production.
Don't overlook render-blocking resources, but don't defer everything indiscriminately. Defer a critical stylesheet or script and you may improve one lab trace while causing a flash of unstyled content, broken interaction, or a worse LCP in the field.
Choosing the Right Tools and Monitoring Setup
No single tool answers every performance question. Lighthouse and WebPageTest are excellent for controlled debugging, while CrUX and Search Console show whether real visitors receive a passing experience. RUM fills in the missing operational detail by associating metrics with sessions, templates, devices, browsers, and interactions.
| Tool | Type | Metrics Covered | Data Freshness | Cost | Best For |
|---|---|---|---|---|---|
| Lighthouse | Lab | LCP, INP-related diagnostics, CLS and supporting audits | Test-time snapshot | Available through Chrome and related tooling | Debugging a reproducible page load |
| PageSpeed Insights | Lab and field | Core Web Vitals plus diagnostic audits | Field data uses a rolling window | Public tool | URL-level diagnosis and field context |
| Search Console | Field | Core Web Vitals grouped by URL patterns | Rolling field reporting | Available through Google Search Console | Site-wide issue prioritisation |
| CrUX | Field | Core Web Vitals and related experience data | Rolling public dataset | Public data with access conditions | Origin and page experience benchmarking |
| SpeedCurve | Lab and field monitoring | Performance metrics and RUM coverage depend on setup | Monitoring cadence | Commercial | Trend tracking and alerts |
| DebugBear | Lab and field monitoring | Performance metrics and diagnostics depend on setup | Monitoring cadence | Commercial | Regression analysis and reporting |
Use PageSpeed Insights when a merchandiser gives you a URL that “feels slow”. Use Search Console when you need to decide which template deserves engineering time. Use CrUX when you want public field context, and use RUM when you need to understand the exact user and interaction patterns behind a metric.
A Shopify team can collect first-party experience signals with the web-vitals JavaScript library, then send permitted measurements into its analytics environment. Keep the implementation lean. A monitoring script that adds meaningful main-thread work undermines the performance it's supposed to measure.
Measurement principle: Lab checks protect the release. Field checks protect the customer.
Put performance checks into delivery
Lighthouse CI can run against representative templates in pull requests and enforce budgets for selected audits. It won't prove that the release passes field data, but it can catch an oversized hero asset, a newly blocking script, or an unexpected increase in JavaScript before the code reaches production.
For teams building a wider reporting layer, SemDash's SEO dashboard guide provides useful context for organising technical and search signals in one reporting workflow. Keep Core Web Vitals visible alongside release notes, app changes, and template ownership, so performance doesn't become an isolated technical score that marketing only sees after a regression.
Building a Sustainable Optimization Workflow
Core Web Vitals decline through ordinary ecommerce activity. A new review application, seasonal banner, testing script, video section, or tracking integration can change the production experience even when nobody edits the performance code directly.
Start every release with a short performance gate. Confirm that above-the-fold images have dimensions and deliberate loading priority, non-critical media is deferred, third-party scripts have an owner, fonts have a fallback strategy, and dynamic content has reserved space. Test representative product, collection, landing, cart, and content templates rather than one convenient URL.
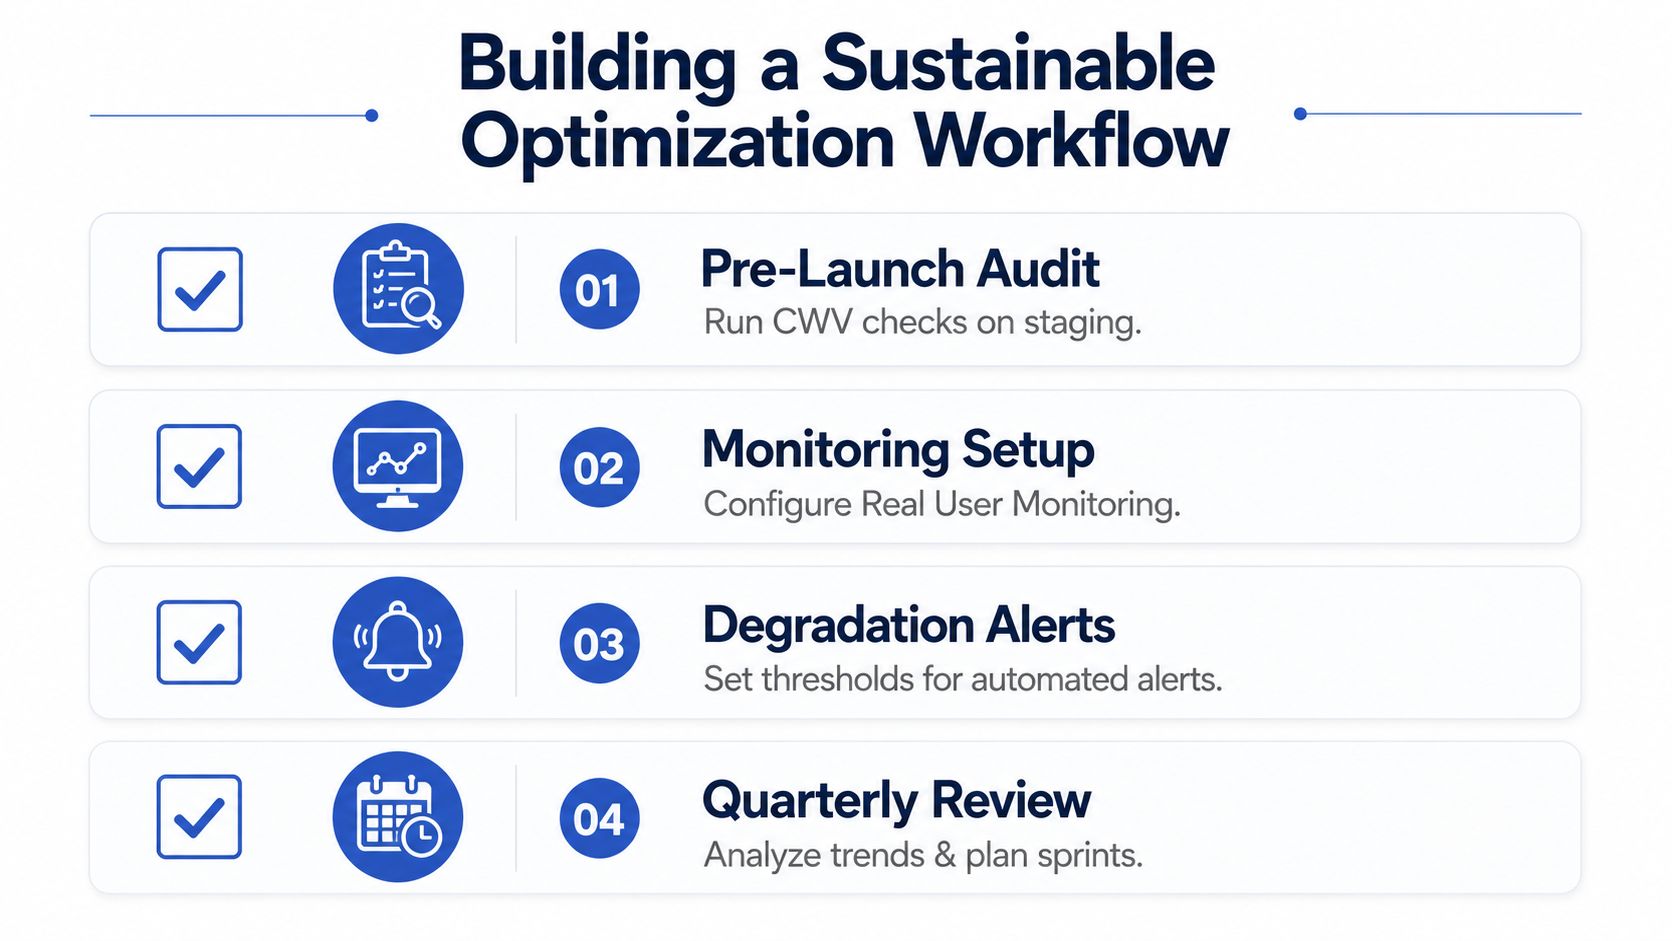
Make ownership visible
Review Search Console and your field-data source on a regular operating cadence. Assign each regression to a template owner, theme developer, app owner, or marketing stakeholder. When someone proposes a new script or visual component, ask what it does, where it loads, and how you'll measure its cost.
Keep a change log that connects releases to metric movement. A field metric may take time to reflect a deployment, so without release dates you'll struggle to separate a fix from a campaign, app update, or seasonal traffic change.
Run a deeper audit periodically to catch accumulated technical debt. Recheck app injection points, unused theme code, media variants, font behaviour, cart interactions, and layout reservations. The aim isn't permanent perfection. It's a feedback loop where lab tests catch regressions early, RUM explains real sessions, and field reports confirm whether the work reached enough visitors.
If your Shopify store passes Lighthouse but fails real-user Core Web Vitals, Grumspot can audit the theme, app injections, templates, and field data to identify the fixes that matter most. Visit Grumspot to discuss a practical performance and technical SEO plan for your storefront.
Let's build something together
If you like what you saw, let's jump on a quick call and discuss your project
Related posts
Check out some similar posts.

- headless commerce Shopify
Explore headless commerce Shopify for UK brands. This guide covers costs, benefits, SEO, and impleme...
Read more
- Shopify performance optimization
Boost your Shopify store's speed & sales with our Shopify performance optimization guide. Audit, fix...
Read more
- shopify site speed
Master your shopify site speed optimization. Audit, fix, and monitor your store for faster load time...
Read more
- Shopify technical audit
Unlock your store's potential with our 2026 guide to a Shopify technical audit. Learn to fix speed, ...
Read more